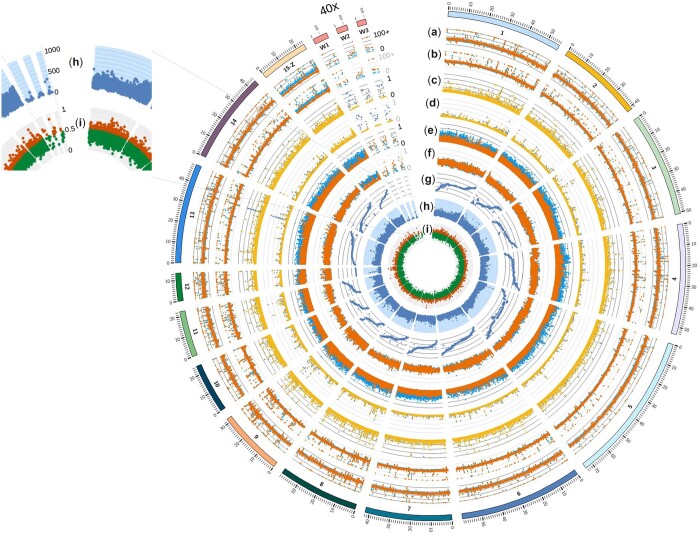
Fig. 1.
Circos plot of salmon lice genome assembly. Linkage groups with marks every million base-pairs were drawn on the outer edge of the Circos plot. Linkage group 15 was labeled as 15-Z to emphasize that LG15 is the sex-chromosome and that the sex-determination system is ZW. The 3 largest scaffolds from the W-chromosome are shown with a 40x magnification and with marks every 100 kb. They are labeled W1-3. a) The average depth of coverage of the Atlantic subspecies samples in 10 kb windows, blue for the males (on 15-z, the top points) and orange for the females (on 15-z, the bottom points). The maximum coverage displayed is 100x. b) The same as A, except for the Pacific subspecies samples. c) The average ratio of missing genotypes relative to other genotypes of the Atlantic subspecies in 10 kb windows, blue for males (on W1, the top points) and yellow for females (on W1, the bottom points). d) The same as C, except for the Pacific subspecies samples. e) The average ratio of heterozygous genotypes relative to the other genotypes of the Atlantic subspecies in 10 kb windows, blue for males (on 15-z, the top points) and orange for females (on 15-z, the bottom points). f) The same as e, except for the Pacific subspecies samples. g) Marey map of the genetic map (Danzmann et al. 2019) used to place contigs onto chromosomes. h) The number of SNPs within 10 kb windows. The white axis lines represent increments of 100. i) The ratio of repetitive elements within 10 kb windows. Orange points are greater than 0.5 (top half). A magnified insert is shown to display the y-axis units.

