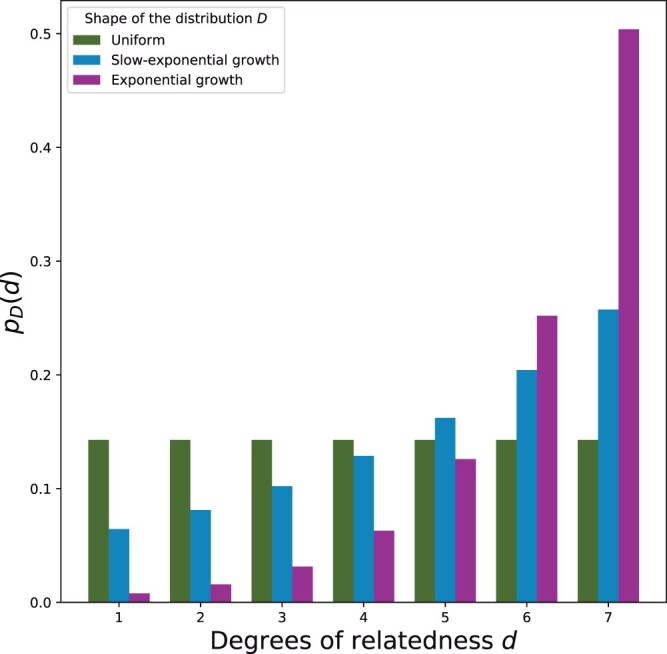
Fig. 1.

Probability mass functions of different distribution shapes for D as a function of degree of relatedness d. Here uniform = 1/7, slow-exponential growth=, and exponential growth=. Total pair counts in the inferred segment data analysis are 21,000 for uniform, 15,541 for slow-exponential growth, and 20,320 for the exponential growth.
