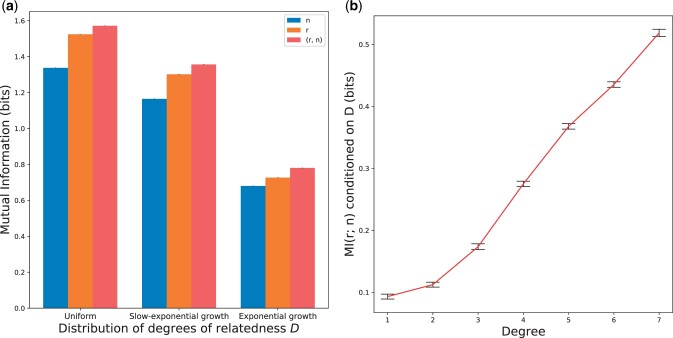
Fig. 2.
Mutual information between relative pairs calculated using exact IBD segments. MI between (a) various IBD feature sets and D for each D distribution shape and (b) r and n conditioned on the relatives’ degree of relatedness. All MI quantities are averaged over 80 independent runs, and the values in (b) are calculated using the uniform distribution with 33,000 pairs per degree. Error bars indicate one standard error and are barely visible in (a) (all are of order ).

