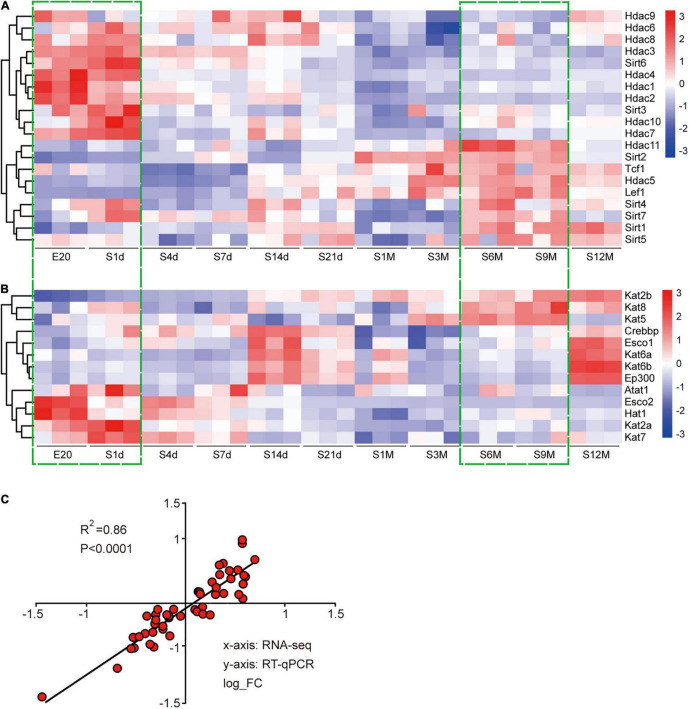
FIGURE 1.
Expression analysis of acetyltransferases and deacetylases during sciatic nerve development. (A) Heat map of the expression of 20 deacetylases during sciatic nerve development. (B) Heat map of the expression of 13 acetyltransferases during sciatic nerve development. Genes with similar expression characteristics are grouped into category. The FPKM value of gene expression is converted into fold. The darker red indicates the greater fold for up-regulation; and the darker blue indicates the greater fold for down-regulation. The two time periods with the most drastic changes in gene expression are marked by green dashed boxes (E20 and S1d vs. S6m and S9m). (C) Correlation analysis of RT-qPCR and sequencing results. The X-axis represents RNA-seq results and the Y-axis represents RT-qPCR results. Differential expression folds are log-transformed, and P-values are calculated by Pearson correction coefficients.

