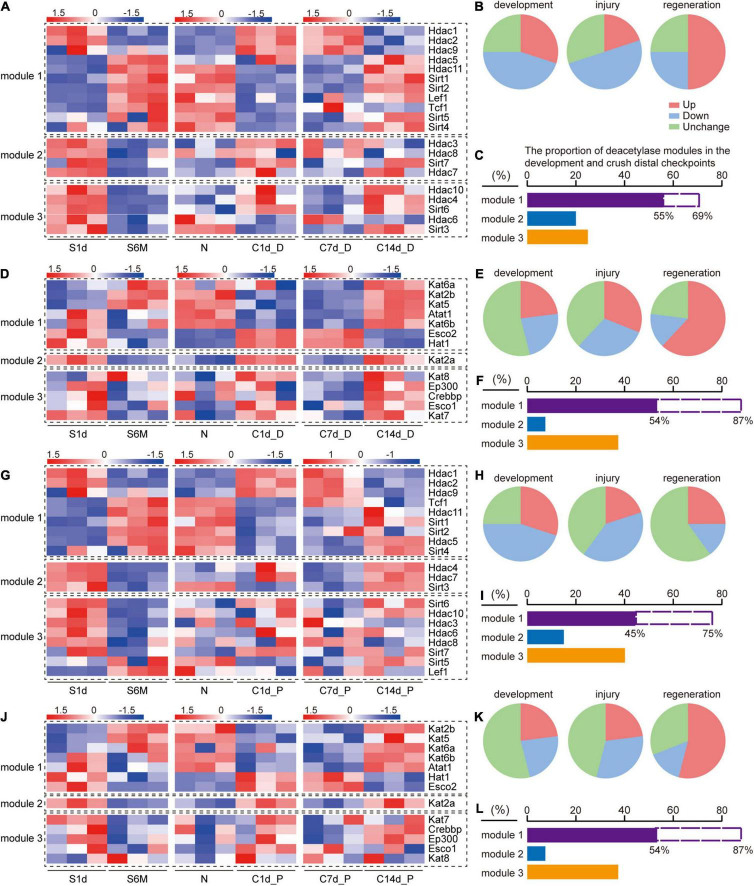
FIGURE 3.
Comparison of expression trends of acetylation regulators during development, injury, and regeneration. S1d-S6m represents the developmental process, N-C1d represents the injury process, and C7d-C14d represents the regeneration process. Modular classification of acetylation regulators is done according to “whether this gene expression trend is the same during development and regeneration and opposite to that during injury.” (A) Deacetylase, distal nerve stump; (D) acetyltransferase, distal nerve stump; (G) deacetylase, proximal nerve stump; (J) acetyltransferase, proximal nerve stump. Each module is separated by a black dashed box. Panels (B,C) describe the information on the statistics and interpretations of panel (A). (B) Three pie charts correspond to development, injury, and regeneration stages in panel (A), respectively. Red, green, and blue color in each pie chart represent the proportions of genes that are up-regulated, down-regulated, and have no expression change, respectively. Similarly, panels (E,H,K) correspond to panels (D,G,J), respectively. (C) The proportion of the number of genes in each module of panel (A). The purple column represents the proportion of module 1 in the three modules, and the dashed blank column represents the proportion of module 1 in module 1 and module 2. Similarly, panels (F,I,L). correspond to panels (D,G,J), respectively.

