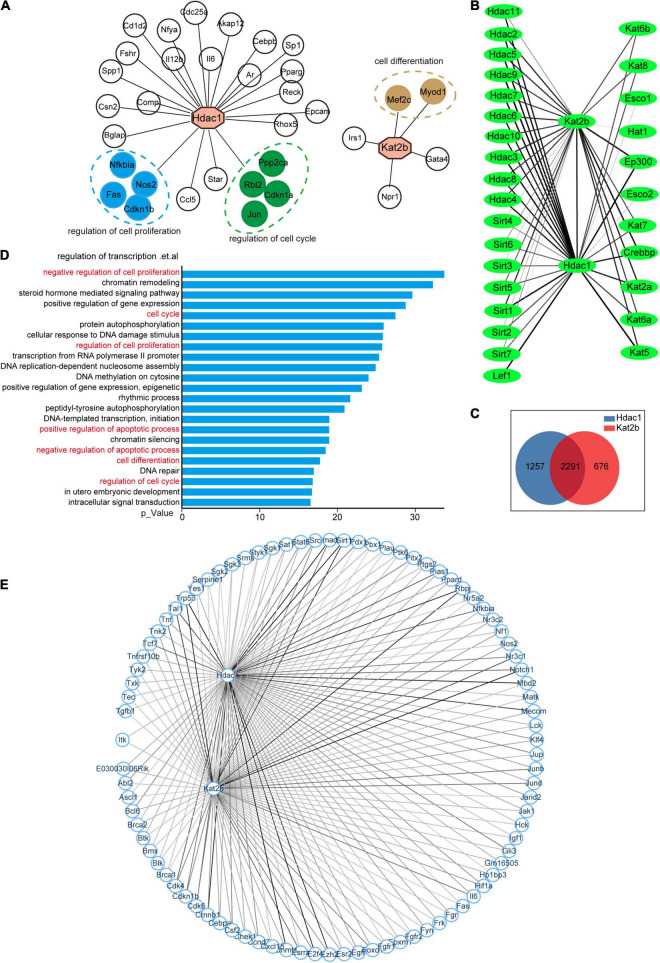
FIGURE 6.
The cell cycle pathway is downstream of Hdac1 and Kat2b. (A) Hdac1 and Kat2b act as downstream molecules regulated by transcription factors. Green color indicates that the gene can be clustered in the regulation of cell proliferation pathway, blue color indicates that the gene can be clustered in the regulation of cell cycle pathway, and brown color indicates that the gene can be clustered in the cell differentiation pathway. (B) Interaction of Hdac1 and Kat2b with other acetylation regulators. The thickness of a line indicates the intensity of the interaction, and the thicker line indicates the stronger interaction. (C) Intersection of molecules that interact with both Hdac1 and Kat2b. (D) GO analysis of intersected genes. Pathways related to the cell cycle are marked in red. (E) Interaction of Hdac1 and Kat2b with proteins related to the regulation of cell proliferation pathway. The thickness of a line indicates the intensity of the interaction, and the thicker line indicates the stronger interaction.

