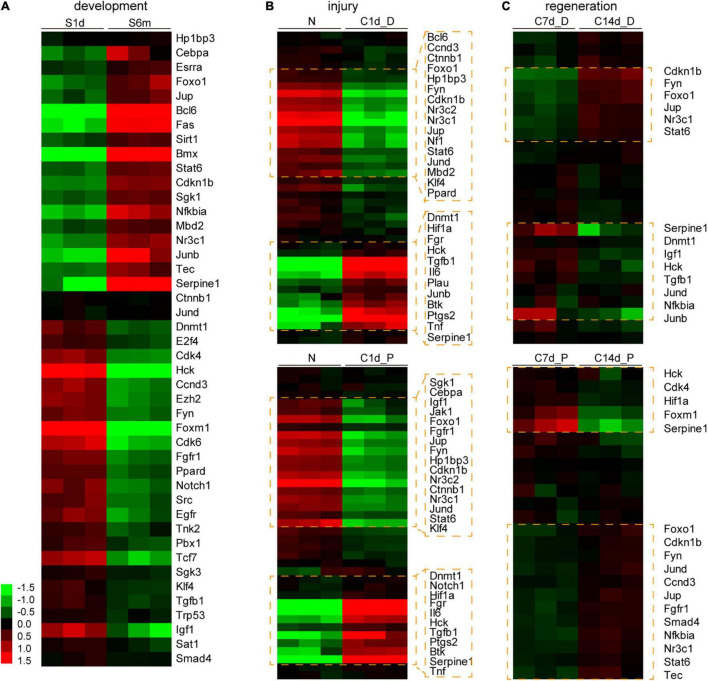
FIGURE 7.
Expression analysis of the downstream genes of Hdac1 and Kat2b during development, injury, and regeneration. Analysis of expression changes of downstream genes of Hdac1 and Kat2b enriched in cell proliferation pathways (shown in Figure 6E) during development (A), injury (B), and regeneration (C). Gene expression data were log transformed, the darker the red, the higher the expression level, and the darker the green, the lower the expression level. Clusters and genes with significant differential expression are marked with orange boxes.

