Figure 6.

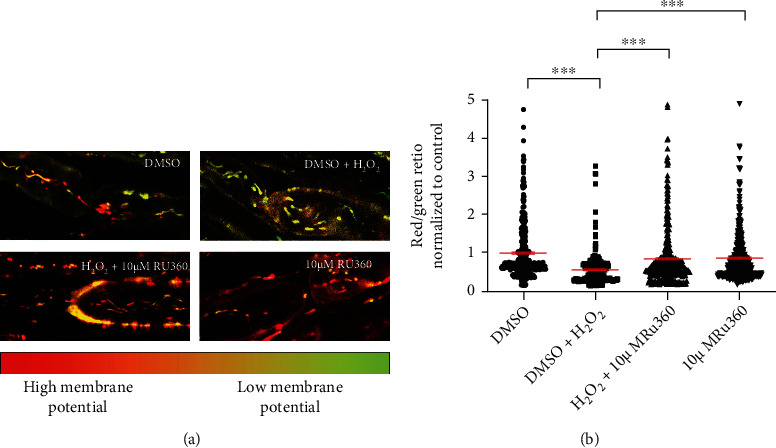
Blocking mitochondrial Ca2+ uptake with Ru360 prevents loss of mitochondrial membrane potential. (a) Representative images of axons in the different treatment groups. The upper left image shows mitochondrial membrane potential under negative control conditions containing mitochondria with high (red) and low (green) mitochondrial membrane potential. Oxidative stress led to loss of mitochondrial membrane potential (upper right image) and a shift to green fluorescence. Ru360 prevented the H2O2 effects (lower left image). The lower right image shows that the application of the Ru360 alone had no effects on mitochondrial functionality compared to control group. (b) Data represent normalized values of individual mitochondria to the mean of the control group (red/green ratio = 1 ± 0.0383). ∗∗∗p ≤ 0.001. The error bars represent the standard error of mean; n = 5 animals and 20 roots; DMSO 5 roots, H2O2 5 roots, H2O2+10 μM Ru360 5 roots, and 10 μM Ru360 5 roots.
