
Figure 1.
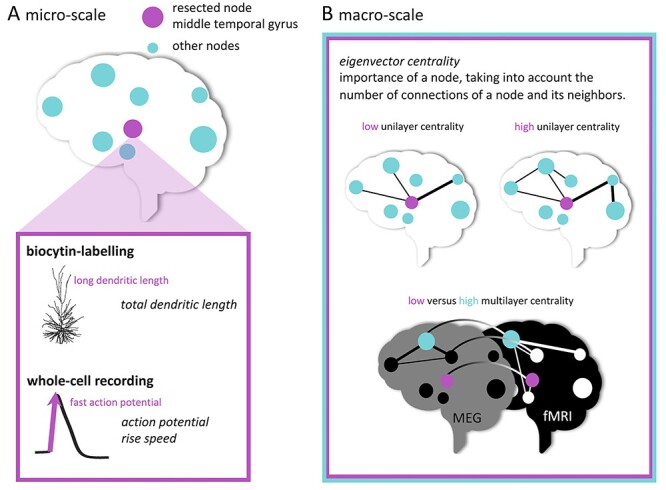
Schematic representation of multi-scale analyses. In (A), cellular tissue collection from the middle temporal gyrus (pink node) is depicted. Morphological analysis and electrophysiological recordings were performed. In (B), the functional network measure of eigenvector centrality is illustrated for the unilayer (fMRI or MEG) and multilayer (combined fMRI and MEG) network analyses.