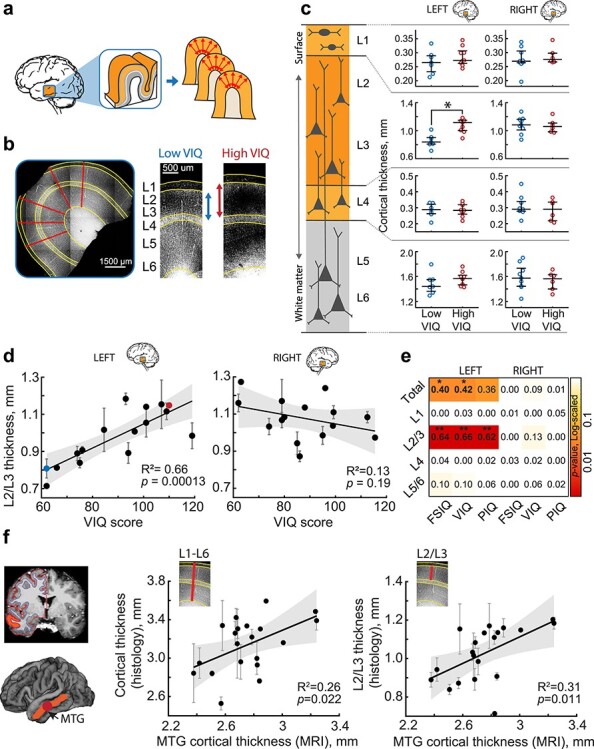
Figure 1.

Thickness of cortical L2/L3 in the left MTG is associated with higher VIQ scores. (a) Slices from temporal lobe tissue resected during neurosurgery were DAPI-stained and imaged to determine the thickness of the cortical layers. (b) Example of cortical thickness measurements: the borders between the cortical layers were drawn on the images (yellow lines). For each patient, the average thickness was calculated along 4–5 radial lines (red) from several slices of gyral crown. (c) Subjects with higher VIQ scores have thicker L2/L3 in the left MTG (Median(IQR) = 1.116(1.002–1.150) mm), than subjects with low VIQ (0.839(0.809–0.903) mm, Mann–Whitney U test, U = 32, P = 0.0021). Open circles represent the average thickness of the different cortical layers from each subject (from top to bottom: L1; L2/L3; L4; L5/L6), red for subjects with VIQ > 90, blue for subjects with VIQ < 90. Separately for left (left panel) and right (right panel) hemisphere (Left: low VIQ: n subjects = 7, n slices = 13, high VIQ: n subjects = 9, n slices = 22. Right: low VIQ: n subjects = 9, n slices = 25, high VIQ: n subjects = 6, n slices = 16). Here and further: long black horizontal lines are median values; vertical lines are interquartile ranges. (d) L2/L3 cortical thickness positively correlates with VIQ in the left (n subjects = 16, n slices = 35, F(1,14) = 27.1), but not in the right MTG (n subjects = 15, n slices = 41, F(1,13) = 1.87). Here and further: error bars indicate SEM, shaded area represents 95% confidence bounds, insets show R2 and P-values. The blue and red data points correspond to the examples shown in b. (e) Heatmap showing linear regression results (R2) for all cortical layers, both hemispheres, for Full Scale (FSIQ), verbal (VIQ) and performance (PIQ) IQ test scores. P-values are color-coded, *P < 0.05; **P < 0.01. (f) Cortical thickness in MTG quantified from MRI scans, correlates with the MTG thickness from histological quantifications shown in c and d. Left panel shows an example of an MRI scan with white-gray matter boundaries highlighted with colored lines, MTG is marked orange, the resected area is marked red. MTG cortical thickness from MRI scans of the resected MTG positively correlates with total cortical thickness (middle, n subjects = 20, n slices = 56, F(1,18) = 6.26) and L2/L3 thickness (right, n subjects = 20, n slices = 56, F(1,18) = 8.1) from histological analysis of the resected MTG.
