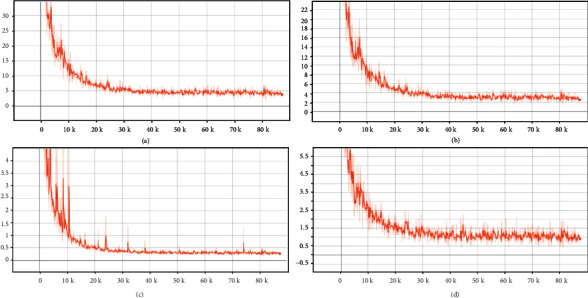
Figure 5.

The changes of losses in the training of PSegNet. From (a–d) are the total loss L, the DHL LDHL imposed on the midlevel feature layer after DGFMM, the semantic loss Lsem, and the instance loss Lins . The x-axis of all plots means the number of trained samples, and the y-axis is the loss value. Given 3640 training samples and the training batch size at 8, we have 455 samples to be trained in each epoch. When the training stops at 190 epochs, the x-axis ends at 455∗190 = 86450.
