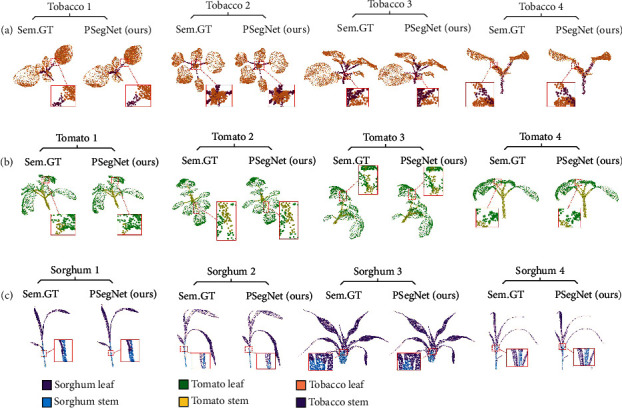
Figure 6.

Qualitative demonstration of our PSegNet for semantic segmentation. (a) Semantic segmentation results of four different tobacco individuals, respectively. (b) Semantic segmentation results of four different tomato plants, respectively. (c) Semantic segmentation results of four different sorghum plants, respectively. Each segmented crop point cloud from PSegNet is compared with its corresponding ground truth (Sem.GT). The meanings of different rendered colors are shown at the bottom of the figure. Some of the areas are enlarged to give more details.
