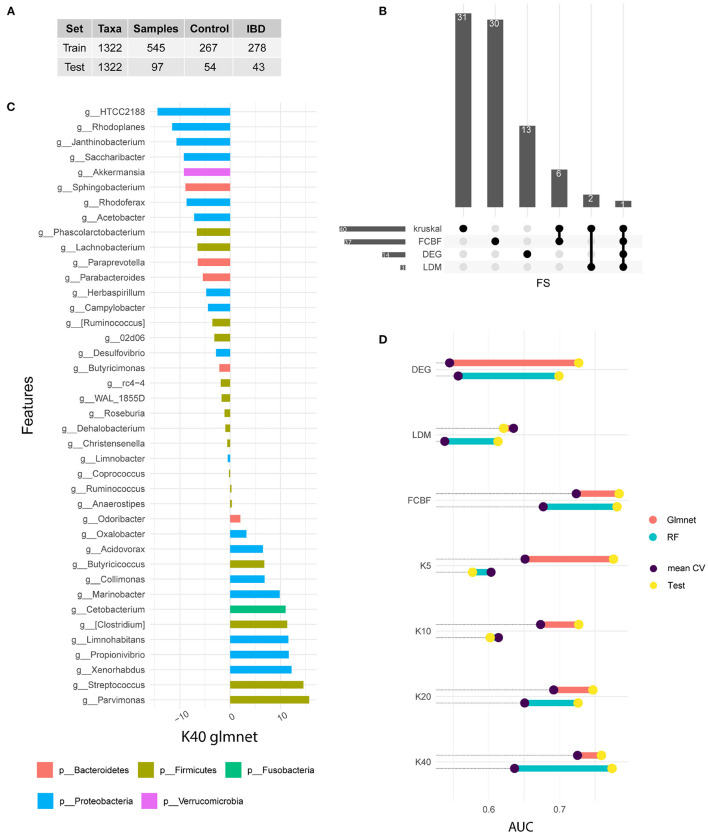
Figure 1.
Signature identification. (A) Training and test data available from the American Gut Project for IBD samples. (B) Upset plot indicating the common features selected by each FS method. (C) Variable importance of the winning model measured after cross-validation. In this case, the 40 genera selected by the Kruskal Wallis method are shown. The bars represent the importance of the variables within the glmnet model. This was done by summing the betas of each variable over all iterations of the CV. (D) Comparison of the performance of the models in train and test. Note that the train value is the result of the arithmetic mean of the five iterations of the CV, while the test result is a single measure. The results of the glmnet and RF models are shown in AUC value.

