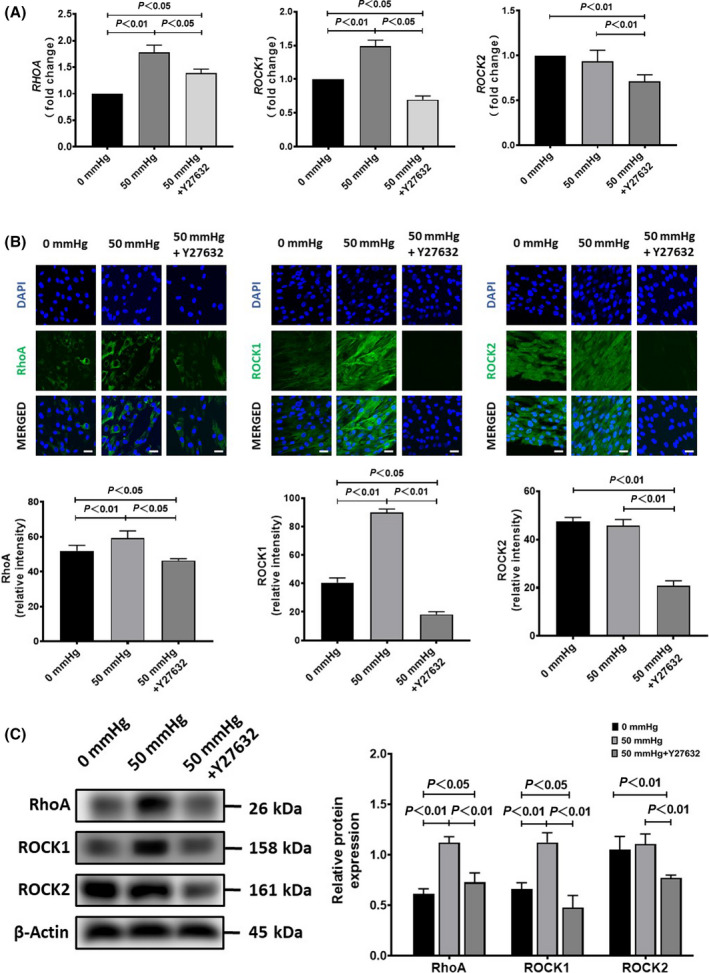
Fig. 3.

The expression of RhoA, ROCK1, and ROCK2 in human hepatic stellate cells (HSCs) after exposure to 50 mmHg pressure for 24 h with or without the addition of Y‐27632 in medium. (A) Quantitative RT‐qPCR data on the fold change of mRNA expression levels (vs. 0 mmHg). (B) Representative images (upper) and semiquantitative data on the immunofluorescence staining intensity. Scale bars = 30 μm. (C) The protein expression by western blot analysis is also shown. Data are represented as mean ± SD from three independent experiments. P values were analyzed by one‐way ANOVA.
