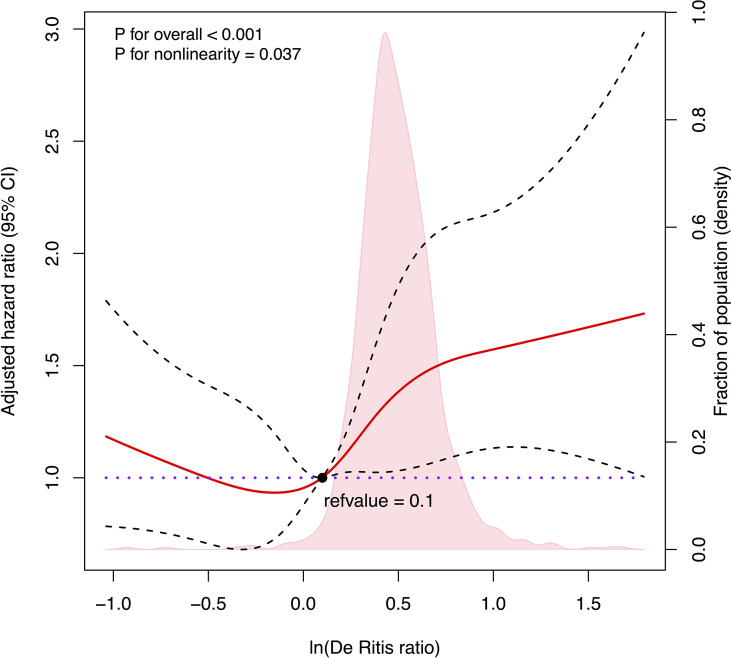
Figure 2.
Cubic spline plot of the association between the natural logarithm of De Ritis ratio and the overall survival among patients with hepatocellular carcinoma undergoing hepatectomy. The solid red line and black dashed line represent the multivariable-adjusted hazard ratios and their corresponding 95% CIs derived from restricted cubic spline regressions with five knots. Pink shade shows fraction of population with different levels of De Ritis ratio. The black solid dot (refvalue = 0.1) indicates the natural logarithm of De Ritis ratio level with a risk of death of 1.0. Reference lines for no association are indicated by the purple dot-dashed line at a hazard ratio of 1.0. Analyses were adjusted for Barcelona Clinic Liver Cancer stage, albumin–bilirubin grade, cancer thrombus, tumor capsule, and hepatitis B virus DNA. ln(De Ritis ratio), the natural logarithm of aspartate transaminase/alanine transaminase ratio.)

