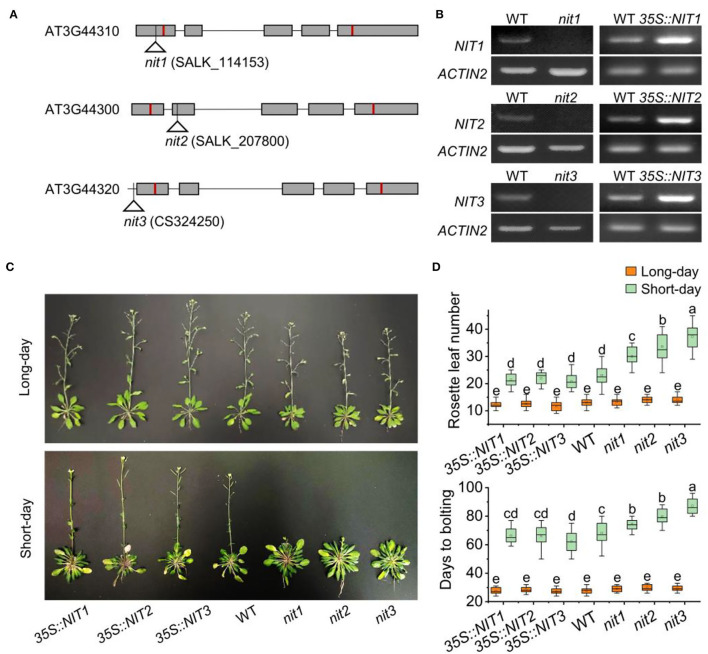
Figure 2.
NIT1/2/3 regulate flowering under short day conditions. (A) The T-DNA insertion sites in NIT1/2/3. Squares and lines represent exons and introns, respectively. The red line shows the start and stop codons. The insertion sites are represented by a triangle. (B) Semiquantitative RT–PCR analysis of NIT1/2/3 gene expression. (C) Flowering phenotypes of 35S::NIT1, 35S::NIT2, 35S::NIT3, WT, nit1, nit2, and nit3. (D) Days to bolting and rosette leaf numbers in 35S::NIT1, 35S::NIT2, 35S::NIT3, WT, nit1, nit2, and nit3. At least 20 plants of each genotype were used for statistical analysis of flowering time. Box plots display median (line), mean (block), interquartile range (box), and whiskers (extending 1.5 times the interquartile range). Significant differences are denoted with distinct letters (Tukey's post hoc test, p < 0.05).

