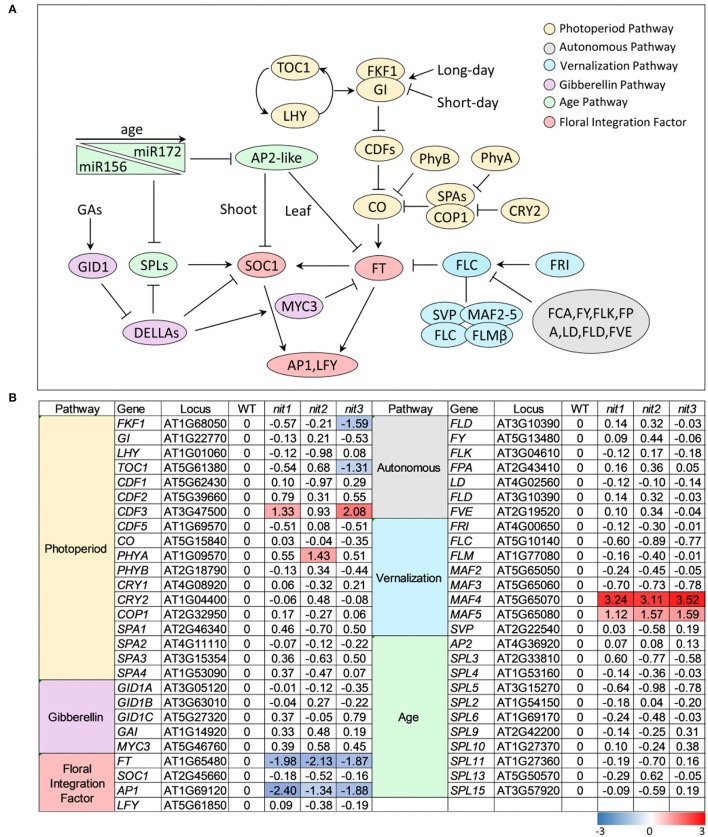
Figure 4.
The transcription profile of key genes involved in different flowering pathways. (A) Outline of flowering pathways in Arabidopsis. (B) The transcription profile of key genes involved in different flowering pathways. The value is log2(Fold Change). The DEGs with log2(Fold Change) ≥1 and p ≤ 0.05 are highlighted in colors. Red refers to increased expression and blue refers to decreased expression.

