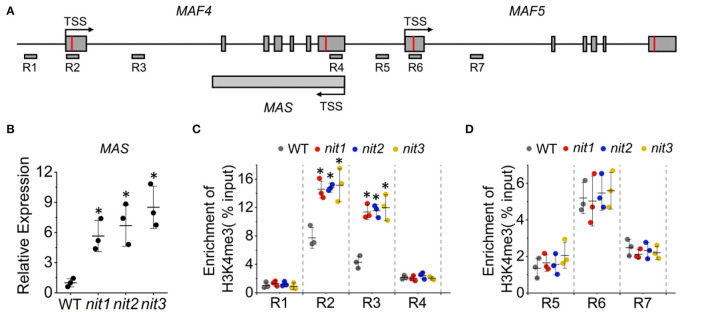
Figure 8.
The MAS-mediated activation of MAF4 gene expression. (A) The schematic representation of MAF4, MAF5, and MAS locus. The positions of primers (R1–R7) used for ChIP qPCR are indicated. (B) The expression of MAS in WT and nit1/2/3 lines. (C) H3K4me3 levels at MAF4 locus in WT and nit1/2/3. (D) H3K4me3 levels at MAF5 locus in WT and nit1/2/3. Enrichment of H3K4me3 was determined by ChIP qPCR. The error bars represent the standard error (three biological repeats). The asterisks at the top of the bar indicate significant differences between nit1/2/3 and WT, p < 0.05(*) by Student's t-test.

