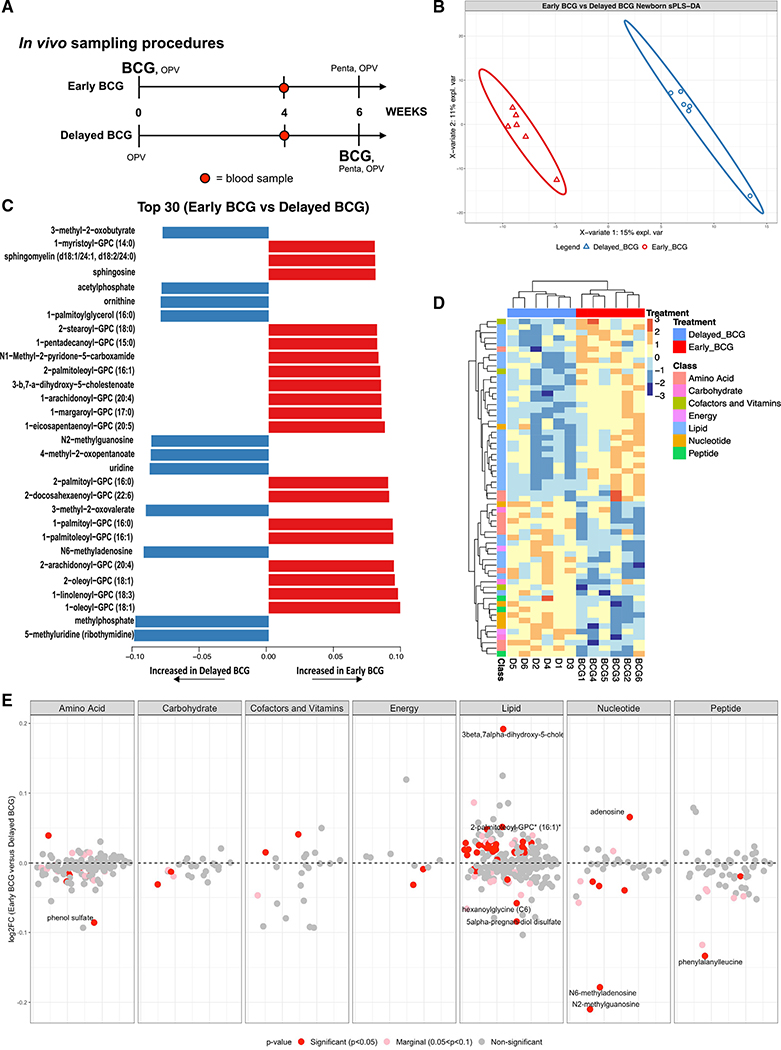
Figure 2. BCG immunization perturbed the human neonatal plasma metabolome.
(A) Schematic layout of blood collection for the in vivo Guinea-Bissau newborn cohort. Early BCG denotes newborn participants given BCG together with OPV at birth. Delayed BCG represents newborn participants who received only OPV at birth and BCG catch-up after the 4-week blood collection.
(B) Multivariate sparse partial least squares discriminant analysis (sPLS-DA) applied to metabolic data demonstrated differences between delayed BCG and early BCG newborns.
(C) The top 30 loading plots of each feature were selected on the first component between treatments with a maximal median value for each metabolite. Blue bars denote metabolites associated with delayed BCG, while orange bars denote metabolites associated with early BCG.
(D) Unsupervised hierarchical clustering of differentially abundant metabolites (DAMs) revealed significant differences in lipid and amino acid responses between early and delayed BCG. Relative metabolite levels were normalized (log-transformed and Pareto scaled) and indicated using a color scale ranging from blue (low) to yellow to red (high).
(E) A plot of the metabolite ratio in the BCG versus delayed groups depicts all identified metabolites by category comparing early versus delayed BCG. Significant metabolites were identified per metabolite class, annotated with red for significant metabolites (p < 0.05), pink for nearly significant metabolites (0.05 < p < 0.1), and gray for non-significant metabolites. Of the seven metabolite categories that differed between the early and delayed BCG groups, lipid metabolites were particularly and significantly perturbed by BCG. Data are presented as log2 fold-change of early versus delayed BCG.

