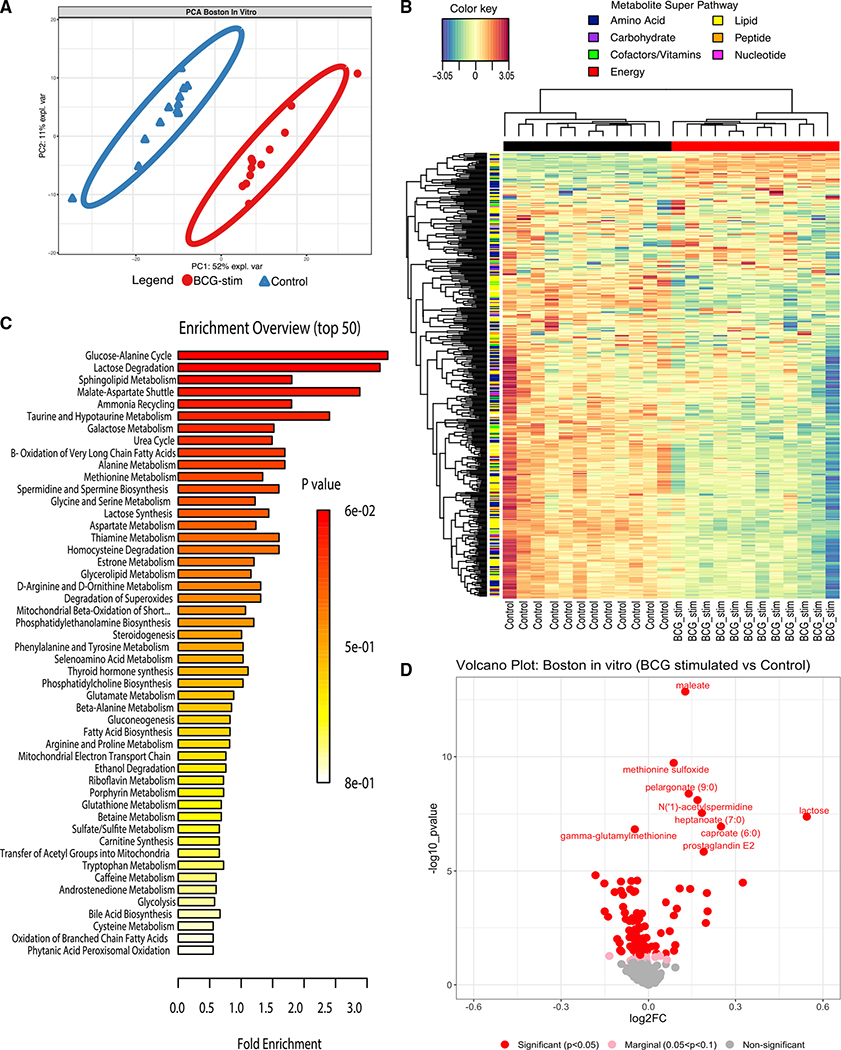
Figure 5. Addition of BCG to human newborn cord blood in vitro induced changes in plasma sugar, amino acid, and lipid pathways.
(A) Human newborn cord blood was stimulated in vitro with vehicle control (saline) or BCG for 18 h. The extracellular fluid (90% plasma v/v) was collected by centrifugation for metabolomics analysis as described in STAR Methods. The principal-component analysis demonstrated a marked separation of metabolites between BCG-stimulated and vehicle-stimulated newborn samples, as indicated by the ellipses.
(B) Unsupervised hierarchical clustering revealed major differences between treatments. BCG stimulation of blood was associated with a reduction in many metabolites, especially in the lipid pathway. Each column represents individual samples; BCG-stim denotes BCG-stimulated blood; control denotes vehicle control.
(C) Top 50 enrichment overview based on metabolite set enrichment analysis (MSEA; MetaboAnalyst) highlighted pathways that were prominently altered after BCG stimulation, including those relating to the glucose-alanine cycle, lactose, and sphingolipid metabolism. Fold enrichment was calculated by dividing the observed number of hits by the expected number of hits of the overrepresented pathway. MSEA calculates a hypergeometric test score employing a cumulative binomial distribution based on the probability of seeing at least a particular number of metabolites with the biological term of interest in a given compound list.
(D) The volcano plot illustrated BCG-induced changes in metabolites as compared with vehicle control. Red color represents significant (p < 0.05), pink marginally significant (p < 0.1–p > 0.05), and gray non-significant lipids.

