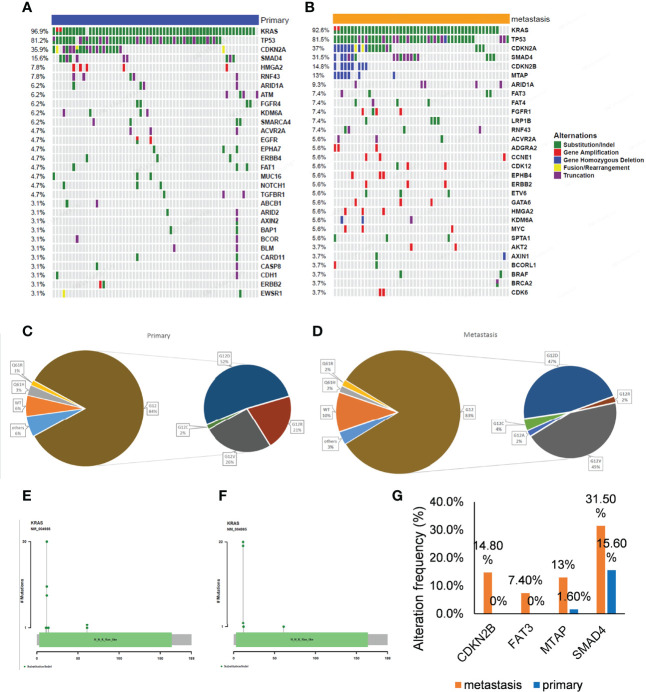
Figure 3.
Gene alterations of 64 primary and 54 metastatic tumors. (A, B) The mutation profiles. The panel shows the matrix of mutations with each type of mutation in a different color. Each column denotes an individual tumor and each row represents a gene. The right panel shows the name of mutations and the left panel shows the proportion of mutations. Green; Substitution/Indel, Red; Gene amplification, Blue; Gene homozygous deletion, Yellow; Fusion/Rearrangement, Purple; Truncation. (C, D) Ratio of different mutation types in KRAS gene. (E, F) The distribution map of KRAS gene mutation sites showed the distribution of mutation sites. (G) Genes with a significant difference in mutation frequency between primary and metastatic tumors.

