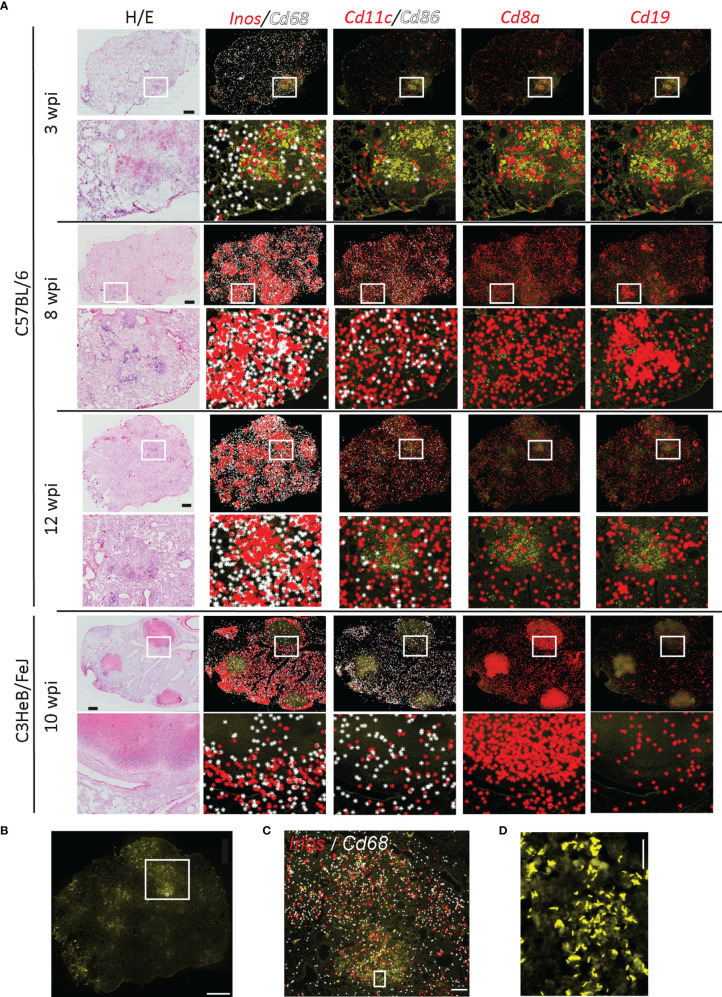
Figure 1.
Immune environments of Mycobacterium tuberculosis bacteria. Localization of immune transcripts in tuberculous lung granulomas. (A) Fixed lung tissue sections of C57BL/6 and C3HeB/FeJ mice at the indicated weeks post Mtb infection (wpi) were analyzed by ISS and stained for DAPI, Auramine–Rhodamine T (AR), and hematoxylin–eosin (HE). ISS signals for indicated transcripts were plotted on AR-stained image as background. One representative image out of the three sections per condition is displayed. Scale bar: 1,000 μm. (B) Image of AR staining of C57BL/6 lung section 12 wpi is displayed with a scale bar of 1,000 μm. Rectangular regions for zoom-ins are indicated. (C) Inos and Cd68 transcripts plotted on AR image (zoom-in of B). Scale bar: 200 μm. (D) Magnification of AR image in B and C is shown for visualization of single bacteria and bacterial clumps. Scale bar: 20 μm.

