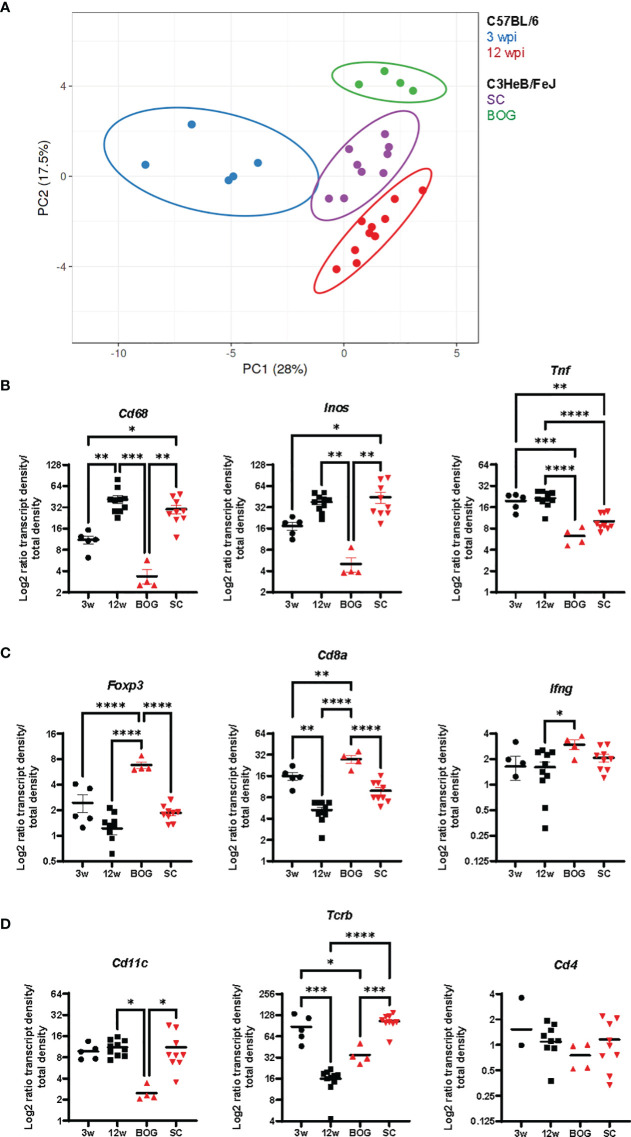
Figure 7.
Bacteria cluster comparison of C57BL/6 and C3HeB/FeJ mice. (A) Principal component analysis of the density ratio of immune transcripts in bacteria clusters of C57BL/6 and C3HeB/FeJ mice is shown. Clusters were identified as described for Figures 5 , 6 with 3 wpi C57BL/6 (blue, n = 5), 12 wpi C57BL/6 (red, n = 10), C3HeB/FeJ SC (purple, n = 9), and BOG C3HeB/FeJ (green n = 4). The ellipse around the clusters indicates the area in which 95% of the samples would be located based on gaussian distribution. (B–D) Density ratios for indicated transcripts of the same clusters as in A are displayed: (A) Cd68, Inos, and Tnf; (B) Foxp3, Cd8a, and Ifng; (C) Cd11c, Tcrb, and Cd4. Mean density ratios ± SEM and individual values are shown, and significant differences are indicated (ANOVA, * for p < 0.05, ** for p < 0.01, *** for p < 0.001, and **** for p < 0.0001).

