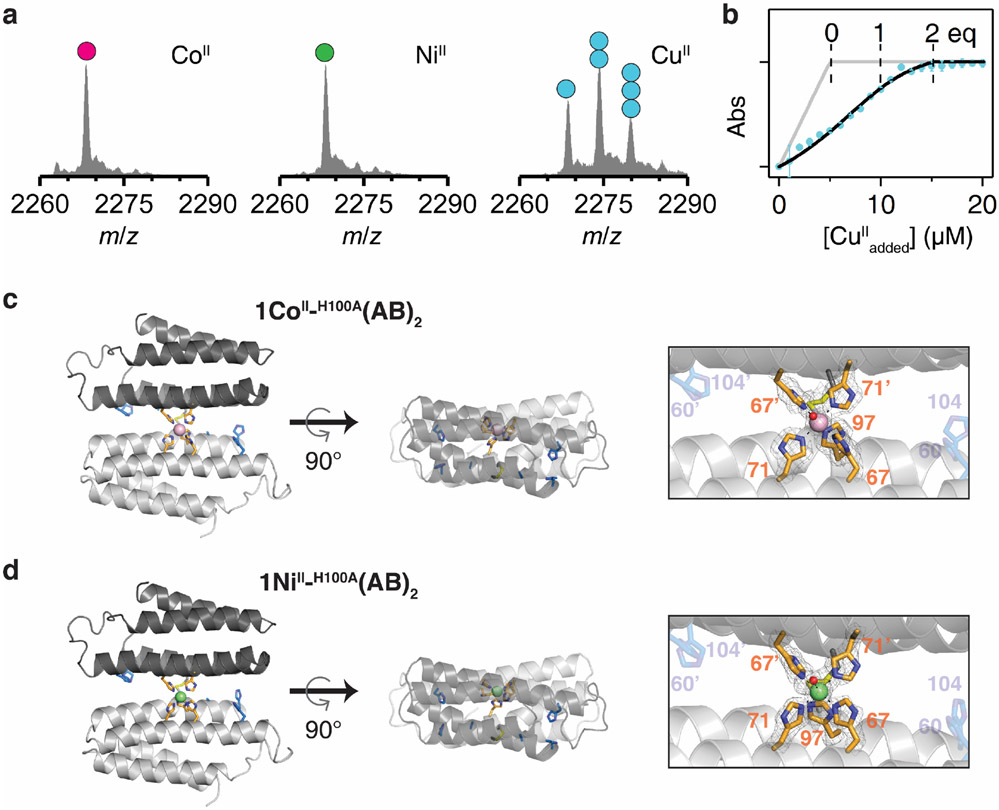
Extended Data Figure 6 ∣. Characterization of metal-bound H100A(AB)2 complexes.
a, ESI-MS spectra of H100A(AB)2 (5 μM) complexed with metal ions. Circles in ESI-MS spectra represent the number of CoII (magenta), NiII (green), and CuII (cyan) ions bound to H100A(AB)2. Metal concentrations were 10 μM. b, Fura-2 competitive metal titration assay of H100A(AB)2 with CuII. Changes in Fura-2 absorbance at 335 nm (cyan) are plotted with theoretical metal-binding isotherms in the absence (grey) and the presence (black) of (AB)2. Experimental data points and error bars in the Fura-2 titration are presented as mean and standard deviation of three independent measurements. Crystal structure of c, CoII_H100A(AB)2 (PDB:7N4G) and d, NiII_H100A(AB)2 (PDB:7N4F). CoII and NiII ions are represented as magenta and green. Atomic details of each metal coordination site are shown in the right panels, with the 2mFo-DFc electron density map (grey mesh) contoured at 5.0 σ (metal) and 1.5 σ (ligand).

