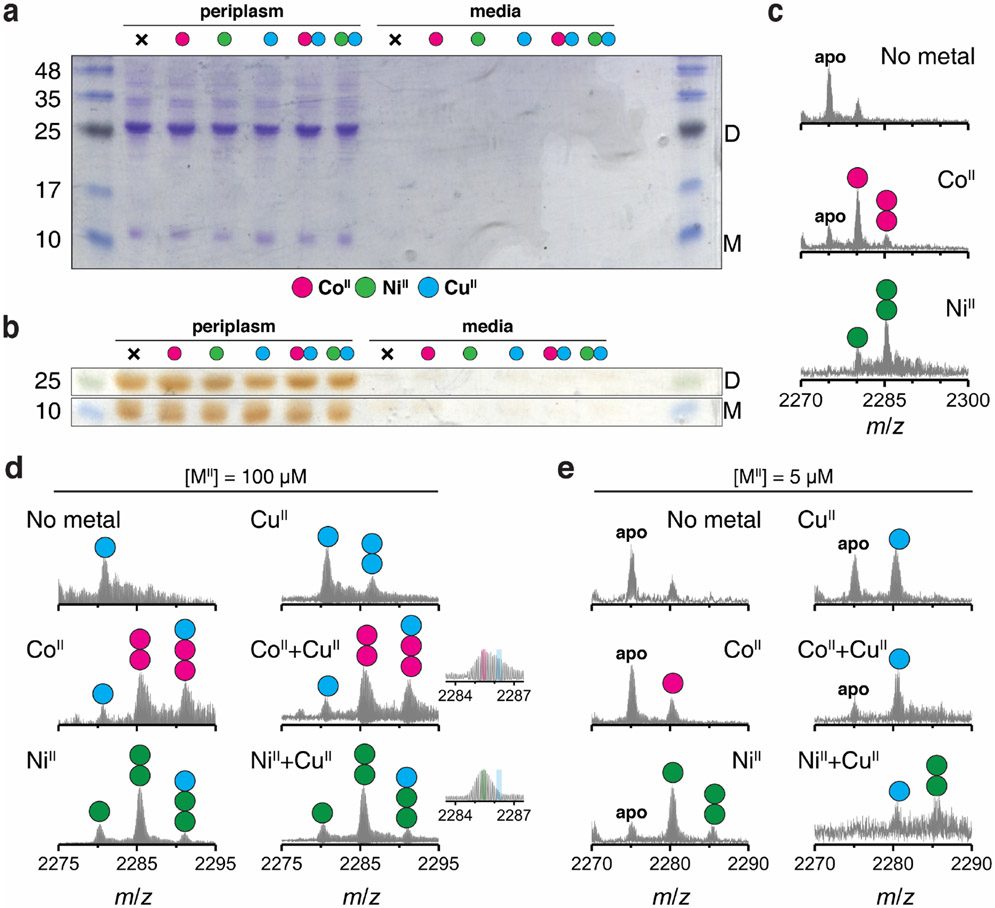
Extended Data Figure 7 ∣. Characterization of periplasmic extracts using SDS-PAGE and ESI-MS.
SDS-PAGE of periplasmic extracts and media stained with a, Coomassie Blue for all proteinaceous contents and b, o-dianisidine for heme proteins. Regardless of supplemented metal ions, no significant amount of (AB)2 dimer and (AB) monomer was observed in media. c, ESI-MS spectra of (AB)2 extracted from cells grown without metal supplement (top) and with CoII (middle) or NiII (bottom) supplement (20 μM) in LB media. ESI-MS spectra of (AB)2 extracted from cells grown with d, 100 μM and e, 5 μM metal ions in LB media. Inlet spectra represent expanded m/z ranges for 2MII-(AB)2 complexes with magenta, green, and cyan lines corresponding to theoretical m/z values of 2CoII, 2NiII, and 2CuII-(AB)2 complexes. Supplemented metal ions are represented as magenta (CoII), green (NiII), and cyan (CuII). Filled circles indicate the number of metal ions bound to (AB)2. D and M in gel pictures refer to the dimer and the monomer, respectively.

