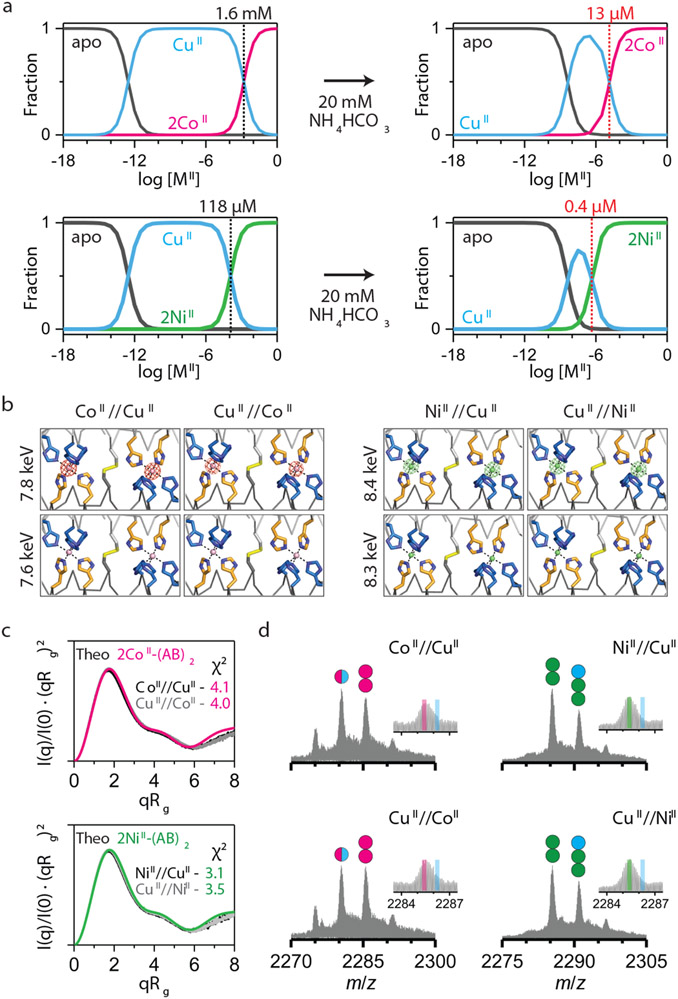
Figure 2 ∣. CoII- and NiII-selectivity of (AB)2.
a, Theoretical fractions of metal-free/bound (AB)2 species calculated from Kd values and buffered metal concentrations in 20 mM MOPS and 150 mM NaCl (left) and 20 mM NH4HCO3 (right). b, Anomalous scattering densities of interfacial metal sites of (AB)2. Anomalous densities contoured at 5.0 σ were collected around K-edge of Co (~7.7 keV) and Ni (~8.3 keV). X-ray data collection and refinement statistics are listed in Extended Data Table 3. c, Experimental Kratky plots of (AB)2 (black/grey) compared with theoretical plots of 2CoII-(AB)2 (magenta) and 2NiII-(AB)2 (green) structures (log-scale plots are shown in Extended Data Figs. 3f-g). d, ESI-MS spectra of (AB)2 under CoII//CuII, CuII//CoII, NiII//CuII, and CuII//NiII competition conditions. Circles in ESI-MS spectra represent the number of CoII (magenta), NiII (green), and CuII (cyan) ions bound to (AB)2. Half circles (magenta/cyan) indicate a mixture of CoII and CuII complexes. Insets represent expanded m/z ranges of 2MII-(AB)2 complexes with magenta, green, and cyan lines corresponding to theoretical m/z values of 2CoII, 2NiII, and 2CuII-(AB)2 complexes, respectively.

