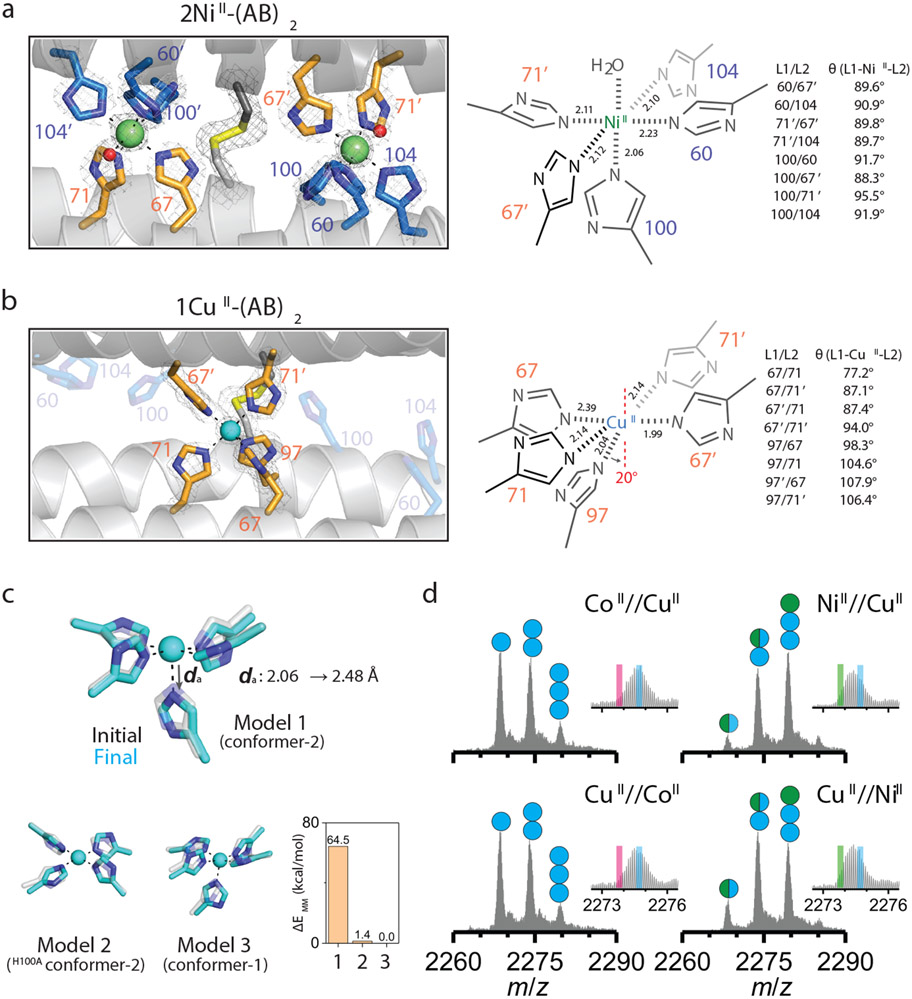
Figure 3 ∣. Primary metal coordination spheres of central and peripheral sites in (AB)2.
Close-up view of 5His-coordination of a, NiII and b, CuII with the 2mFo-DFc electron density map (grey mesh) contoured at 5.0 σ (metal) or 1.5 σ (ligand). Coordination distances and angles between MII and ligands are shown on the right. c, QM-MM optimized CuII coordination in Model 1 (CuII in peripheral site of (AB)2), Model 2 (CuII in the peripheral site of H100A(AB)2), and Model 3 (CuII in the central site of (AB)2). The initial (crystal structures) and final (QM-MM optimized structures) conformations of Models 1–3 are represented as grey and cyan, respectively. Relative MM energies of (AB)2 conformations resulting from the optimized Models 1–3 are presented in the bar graph. d, ESI-MS spectra of H100A(AB)2 under competitive metal binding conditions. Circles in ESI-MS spectra represent the number of NiII (green) and CuII (cyan) ions bound to (AB)2. Half circles (green/cyan) indicate the mixture of NiII and CuII complexes. Insets show expanded m/z ranges for 2MII-(AB)2 complexes with magenta, green, and cyan lines corresponding to theoretical m/z values of 2CoII, 2NiII, and 2CuII_H100A(AB)2 complexes, respectively.

