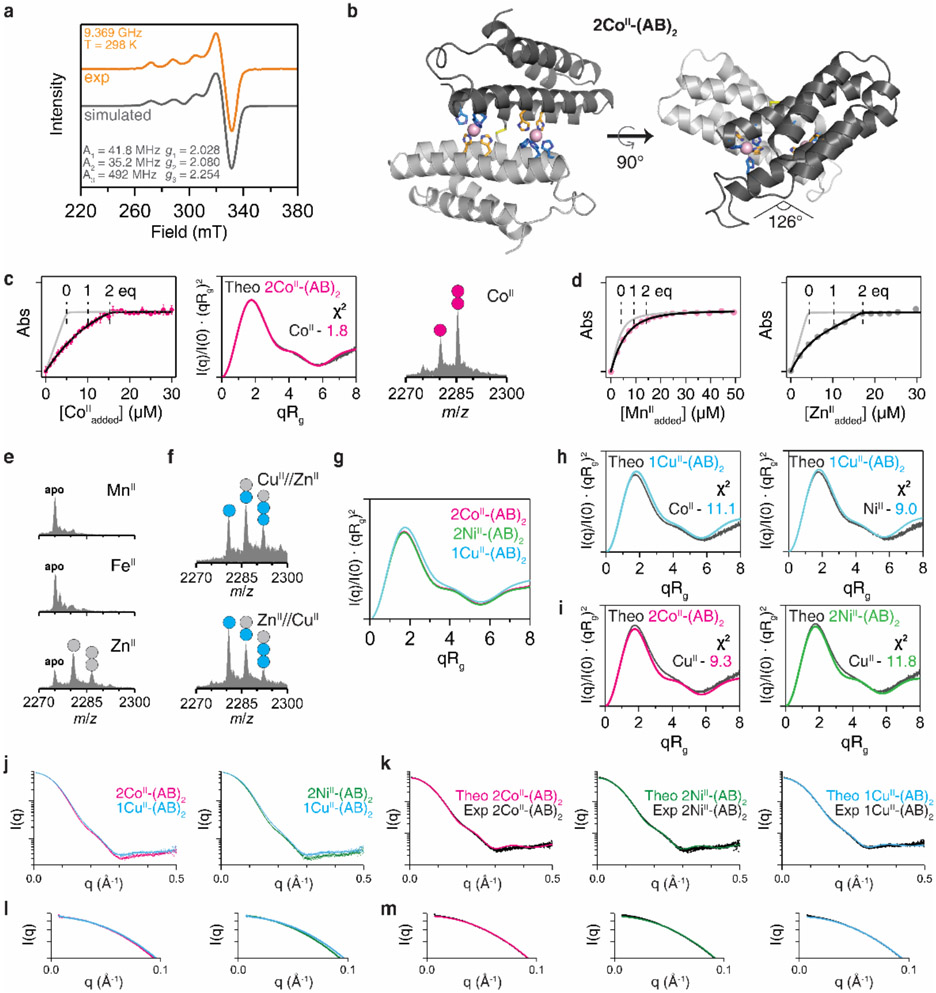
Extended Data Figure 2 ∣. Structural characterization and metal-binding analysis of MII-(AB)2 complexes.
a, X-band EPR spectrum of CuII-(AB)2 (orange) and simulated pattern (black line), along with the fit parameters consistent with a rhombic coordination geometry. Conditions: 2.5 mM CuII, 20 mM MOPS (pH 7.4) and 150 mM NaCl, 298 K. b, Crystal structure of 2CoII-(AB)2. CoII ions are represented as magenta spheres. c, Solution characterization of 2CoII-(AB)2 complex by competitive Fura-2 titration (left), SAXS (middle), and ESI-MS (right). Circles (magenta) in ESI-MS spectrum represent the number of CoII ions bound to (AB)2. Experimental data points and error bars in the Fura-2 titration are presented as mean and standard deviation of three independent measurements. d, Competitive metal-binding titrations (AB)2 for MnII (pink) and ZnII (grey) binding. Mag-Fura-2 and Fura-2 were used for MnII and ZnII titrations, respectively. e, Investigation of MII-(AB)2 complexation using ESI-MS: MnII (top), FeII (middle), and ZnII (bottom). MnII- and FeII-(AB)2 complexes were not observed owing to the low metal binding affinities. f, ESI-MS spectra of (AB)2 collected under CuII//ZnII and ZnII//CuII competition conditions. CuII outcompetes ZnII or forms heterometallic complexes of (AB)2. g, Theoretical SAXS scattering profiles of MII-(AB)2 generated by CRYSOL. Experimental SAXS profiles of h, 2CoII- and 2NiII-(AB)2 complexes compared with theoretical scattering profile of 1CuII-(AB)2 (cyan), and i, 1CuII-(AB)2 complex compared with theoretical scattering profiles of 2CoII- (magenta) and 2NiII-(AB)2 (green). Log-scale plots of Fig. 1e-f to compare j, experimental scattering profiles between 2CoII/2NiII-(AB)2 and 1CuII-(AB)2 and k, experimental scattering profiles of 2CoII- (left), 2NiII- (middle), and 1CuII-(AB)2 (right) with theoretical scattering profiles. Expanded low q-ranges of the scattering plots in l, Extended Data Fig. 2j and m, Fig. 2k.

