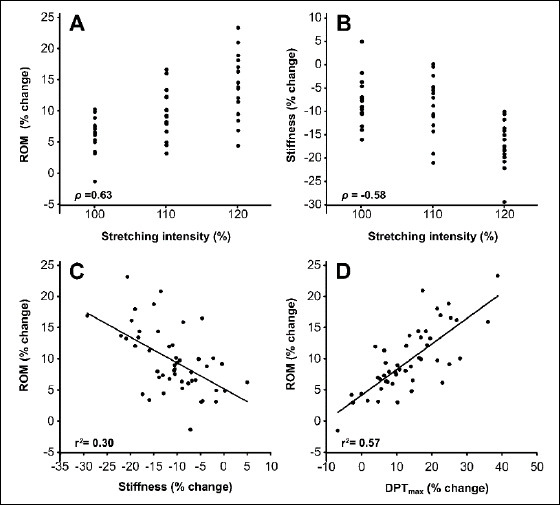
Figure 6.

Spearman’s and Pearson’s correlation coefficients. The relationships between the changes in indicators of flexibility and stretch intensity. A moderate correlation was observed between stretch intensity and changes in A) range of motion (ROM) (ρ = 0.63) and B) passive stiffness (ρ = –0.58). Moderate-to-strong correlations were observed between changes in ROM and changes in C) passive stiffness (r = –0.55) and D) maximum dynamic passive torque (DPTmax) (r = 0.77).
