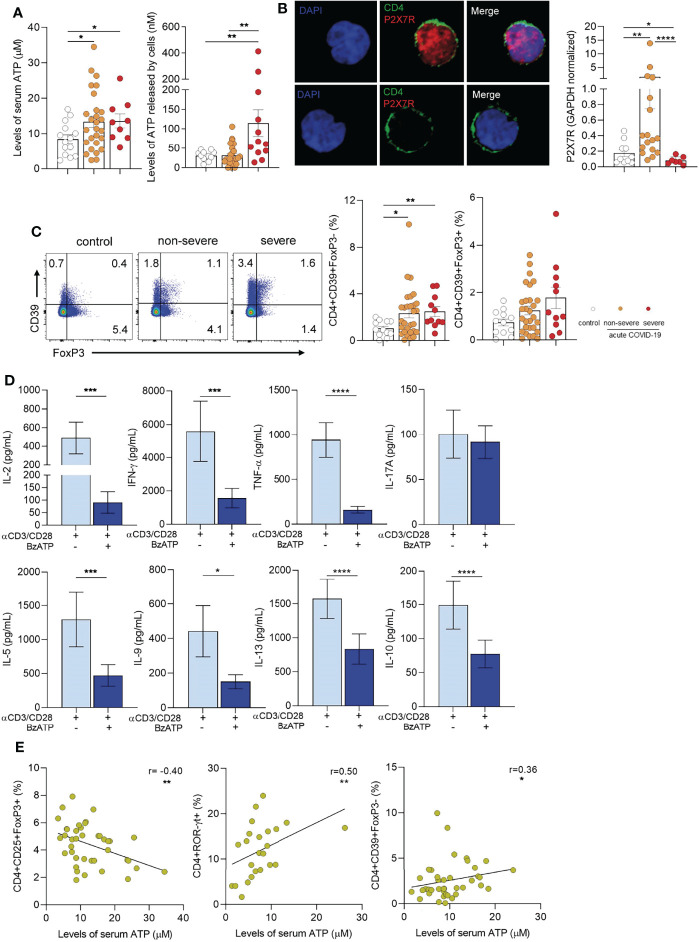
Figure 2.
Extracellular ATP-P2X7R axis in children with COVID-19. (A) Left panel: Levels of ATP in plasma from healthy children (controls, n = 14), and children with COVID-19 (non-severe, n = 27 and severe, n = 9) measured by luminometry. Right panel: PBMCs (5x10⁶/mL) from healthy children (controls, n = 12), and children with COVID-19 (non-severe, n = 25 and severe, n = 12) were stimulated with anti-CD2/CD3/CD28 coated beads (0.3 µg/mL) during 4 min. Levels of extracellular ATP were measured in the supernatant by luminometry. (B) Left panel: Confocal microscopy of P2X7R expression in purified CD4+ T cells (green: CD4, red: P2X7R). Nuclear counterstain with DAPI was used. Representative images from a child with non-severe COVID-19 are shown at x300. Right panel: Basal P2X7R expression in PBMCs from healthy children (controls, n = 10) and children with COVID-19 (non-severe, n = 17 and severe, n = 7) quantified by qRT-PCR. (C) Left panel: Representative dot plot showing the expression of FoxP3 and CD39 in CD4+ T cells of heathy children and children with COVID-19 (non-severe and severe). Middle and Right panels: Frequency of CD4+CD39+FoxP3- T cells (middle) and CD4+CD39+FoxP3+ T cells (right) in healthy children (n = 12), and children with COVID-19 (non-severe, n = 29 and severe, n = 11). Data are expressed as percentage of CD4+ T cells. (D) Purified CD4+ T cells (1×10⁶/mL) from children with COVID-19 (n = 15) were stimulated with anti-CD2/CD3/CD28 coated beads (0.035 µg/mL) and treated or not with BzATP (100 µM) during 3 days. Levels of cytokines were quantified in the culture supernatant by multiplex flow cytometric bead array. (E) Graphs showing correlations between the frequency of CD4+CD25+FoxP3+ Tregs (n = 40, left), CD4+ROR-γt+ T cells (n = 24, middle), and CD4+CD39+FoxP3- T cells (n = 40, right) and the levels of ATP in plasma. Mean ± SEM of n donors are shown in (A, B) (right), (C) (middle and right) and (D) P values were determined by Mann-Whitney U test, Kruskal-Wallis test and Wilcoxon test. Correlations were evaluated by using Spearman rank correlation coefficient test. *p<0.05, **p < 0.01, ***p < 0.001, ****p < 0.0001.

