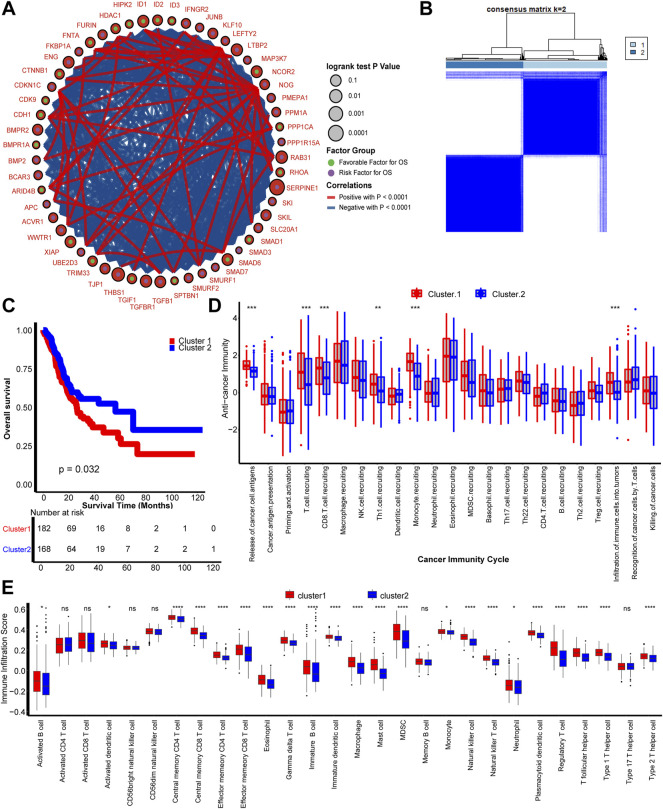
FIGURE 1.
TGFβ patterns and corresponding tumor microenvironment infiltration characterization. (A) Fifty-four TGFβ pathway-related genes correlated with GC. Green and purple dots represent favorable and risk factors for overall survival respectively. The prognosis of each gene is expressed by the size of the circle. Curves between linked dots show the negative (blue) and positive (red) correlation between TGF pathway-related genes. (B) The consensus score matrix shows that all samples were grouped into clusters by the value of consensus score groups in different iterations (k = 2 in TCGA-STAD). (C) Survival analysis based on the TCGA-STAD dataset of TGFβ Cluster1 (red) and TGFβ Cluster 2 (blue). (D) Different activities of cancer immunity cycles between TGFβ Cluster 1 (red) and TGFβ Cluster 2 (blue). (E) TME immune cell infiltration scores between TGFβ Cluster 1 (red) and TGFβ Cluster 2 (blue). Ns, not significant; *p < 0.05; **p < 0.01; ***p < 0.001; ****p < 0.0001.

