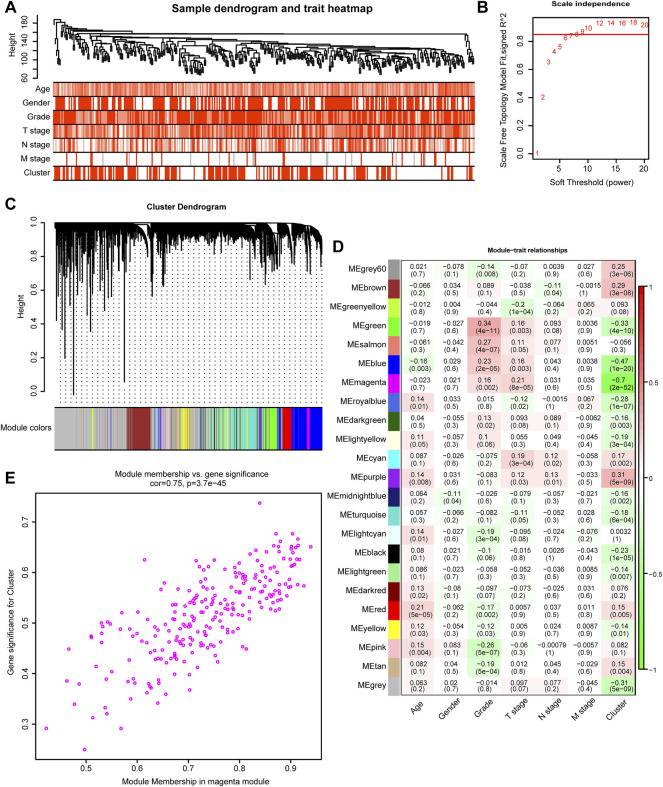
FIGURE 2.
TGFβ-related modules detected by WGCNA. (A) Clustering dendrogram and heatmaps of clinical characteristics (age, sex, tumor stage, tumor grade, and cluster) based on 350 samples in the TCGA-STAD dataset. (B) Scale independence analysis by the scale-free topology model of different soft-threshold powers. (C) Cluster dendrogram of differentially expressed genes based on the topological overlap. (D) Heatmap of the correlation between various gene modules and clinical characteristics (age, sex, tumor stage, tumor grade, and cluster). Red and green represent a positive and negative correlations, respectively. (E) The Scatter plot shows the correlation between gene memberships in the magenta module.

