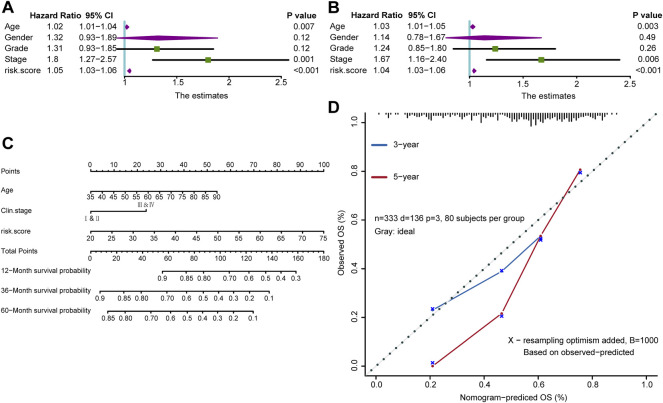
FIGURE 4.
A nomogram in the TCGA-STAD cohort combined with risk score and clinicopathological characteristics. (A,B) Univariate and multivariate Cox analyses of the risk score and clinicopathological characteristics. (C) The survival outcomes at 12-month, 36-month, and 60-month were predicted using the nomogram. (D) Calibration curves of the nomogram were conducted using the Hosmer-Lemeshow test.

