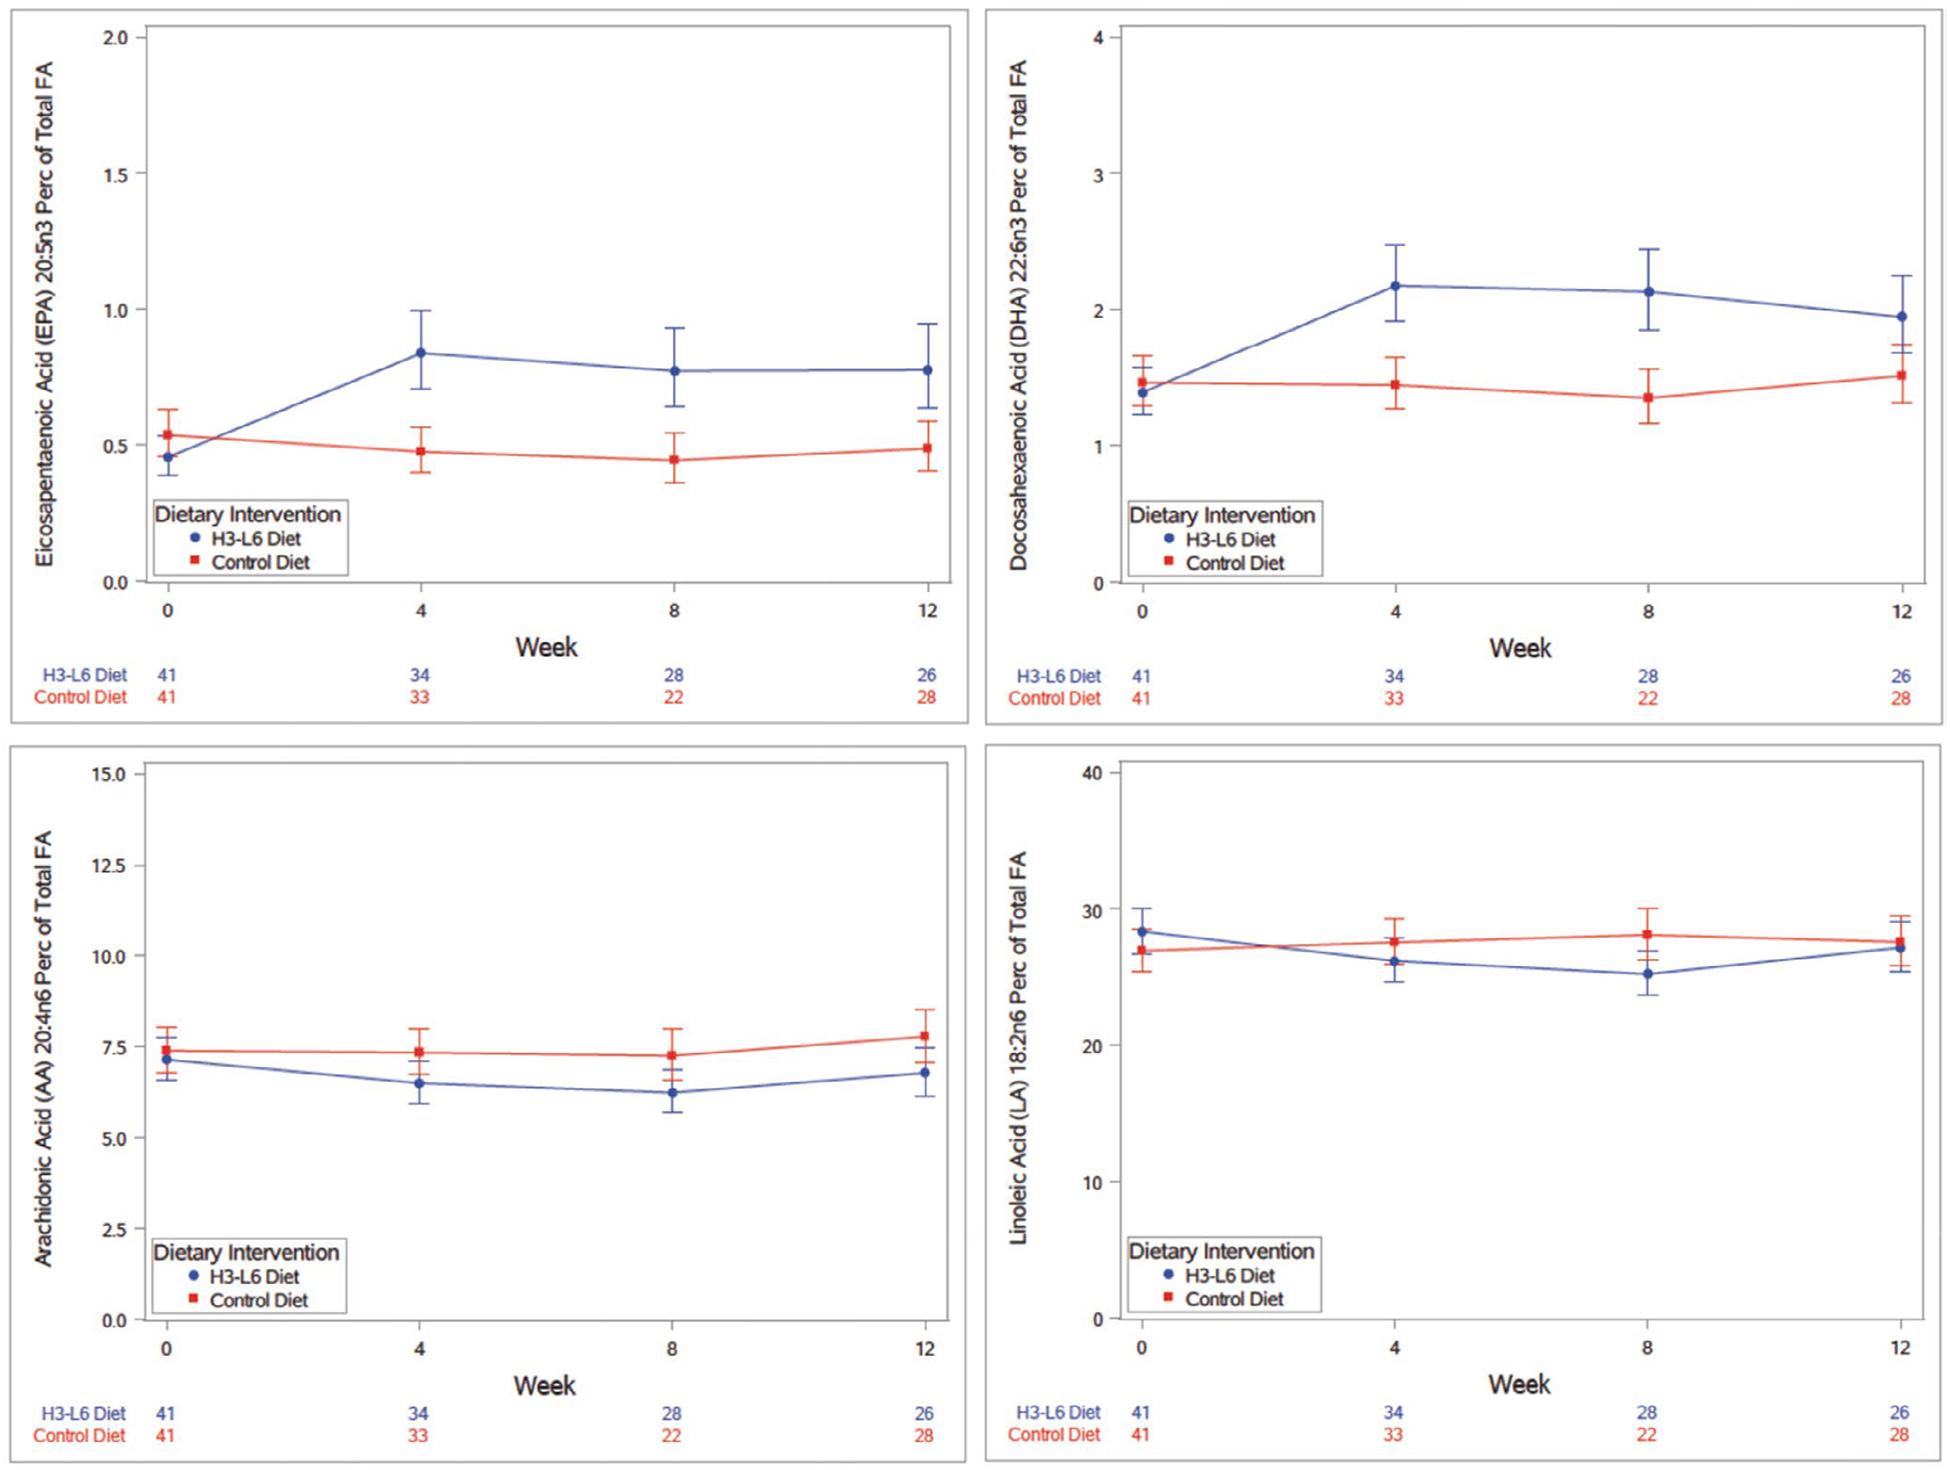
FIGURE 3.

Plotted mixed model geometric mean estimates for eicosapentaenoic acid, docasahexaenoic acid, arachidonic acid, and linoleic acid concentrations as percent of total fatty acid concentration over the duration of Phase 1 intensive dietary intervention with corresponding 95% confidence intervals, adjusted for gender. Perc, percent; FA, fatty acid. X-axis table delineates the number of samples analyzed at each time point by diet group (study week visit number), where week 0 represents the Baseline visit (participants were randomized to their dietary intervention group at week 0) and week 12 was the last Phase 1 study visit for the intensive dietary intervention phase
