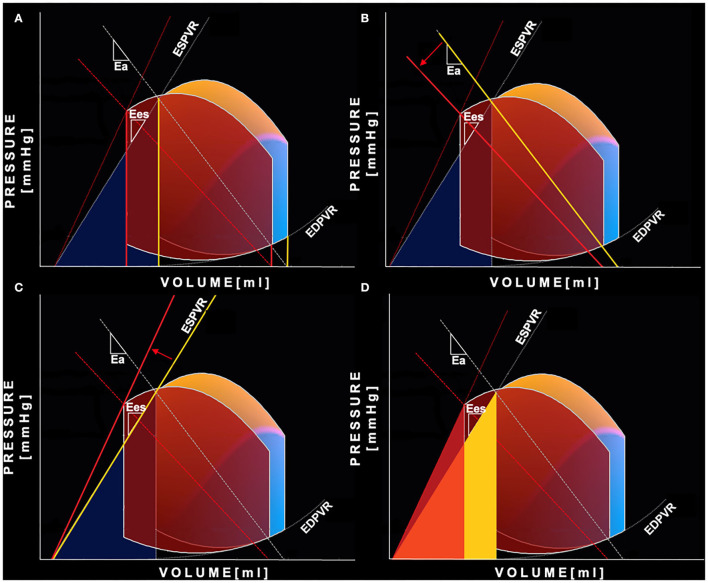
Figure 1.
Pressure-Volume curve changes after Sacubitril-Valsartan. Representation of the non-invasive PV loop analysis of a patient before (yellow-blue PV loop) and after 6 months (red PV loop) of therapy with Sacubitril- Valsartan. (A) shows the reduction of both left ventricular end-systolic and end-diastolic volumes (yellow is “before,” red is “after”). The greater relative reduction of the end-systolic volume leads to an increase in stroke volume and ejection fraction. (B) shows decreased left ventricular afterload reflected by a less steep arterial elastance line (yellow is “before,” red is “after”); (C) shows increased end-systolic left ventricular elastance—steeper end-systolic pressure volume relation (yellow is “before,” red is “after”); (D) shows reduction of mechanical potential energy: the light yellow area is the PE before the therapy, the red is PE after the therapy. In orange is displayed the area of overlap between the aforementioned areas. PE, potential energy; PV loop, pressure-volume loop.

