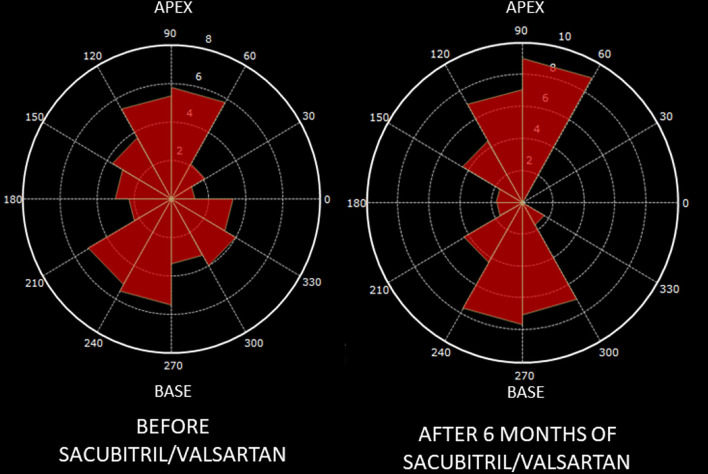
Figure 2.
Changes in hemodynamic forces distribution after Sacubitril-Valsartan. Graphic representation on a polar histogram of left ventricular hemodynamic forces (LV-HDFs) distribution in a patient: LV-HDFs distribution assessed over the entire cardiac cycle at baseline (left) and after 6 months of therapy with sacubitril-valsartan (right), showing a re-alignment of HDFs due to an improvement of longitudinal forces (apex to base, AB) over transversal ones (latero-septal, LS) and consequently a reduction of HDFs LS/AB ratio. AB, apex to base; HDFs, hemodynamic forces; LV, left ventricle; LS, latero-septal; LS/AB ratio, latero-septal over apex to base ratio.

