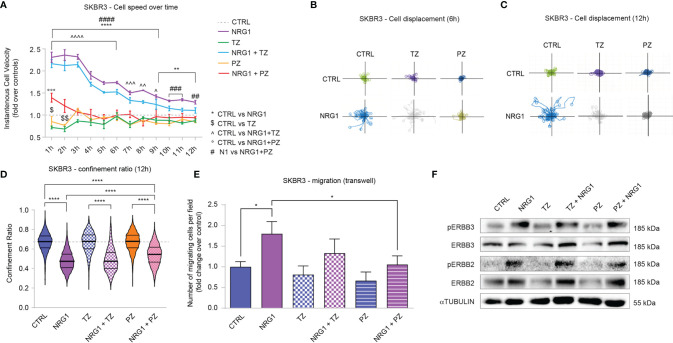
Figure 4.
Treatment with NRG1 in SKBR3 (HER2+) breast cancer cells induces cell motility and reduces trastuzumab and pertuzumab efficacy. (A) Cell speed analysis over time by Livecyte technology of SKBR3 cells treated with/without NRG1 (10 ng/mL), alone or in combination with trastuzumab (10 µg/mL) or pertuzumab (10 µg/mL). Cell velocity has been detected every hour up to 12 hours and normalized to control cells (dotted line); (B, C) SKBR3 cell displacement analysis by Livecyte technology. Representative track plots of SKBR3 treated with/without NRG1 (10 ng/mL), alone or in combination with trastuzumab (10 µg/mL) or pertuzumab (10 µg/mL), up to 6 and 12 hours are provided in (B, C), respectively; (D) Confinement ratio analysis of SKBR3 cells by Livecyte technology. Violin plots of SKBR3 treated with/without NRG1 (10ng/mL), alone or in combination with trastuzumab (10 µg/mL) or pertuzumab (10 µg/mL) for 12 hours; (E) Transwell migration assay performed on SKBR3 cells treated with/without NRG1 (10 ng/mL), alone or in combination with trastuzumab (10 µg/mL) or pertuzumab (10 µg/mL) for 20 hours; (F) Western blot analysis of phosphorylated (active) and total ERBB3 and ERBB2 protein levels in lysates of SKBR3 cells cultured in vitro and treated with/without NRG1 (10 ng/mL), alone or in combination with trastuzumab (10 µg/mL) or pertuzumab (10 µg/mL) for 30 minutes. In all panels, numerical data are presented as mean (error bars show s.e.m.); statistical significance was determined using two-way ANOVA in (A) and one-way ANOVA in (D, E) followed by Tukey’s test; (*, $, ^) p < 0.05, (**, $$, ^^) p < 0.01, (***, ^^^, °°°, ###) p < 0.001, (****, ^^^^, ####) p < 0.0001.

