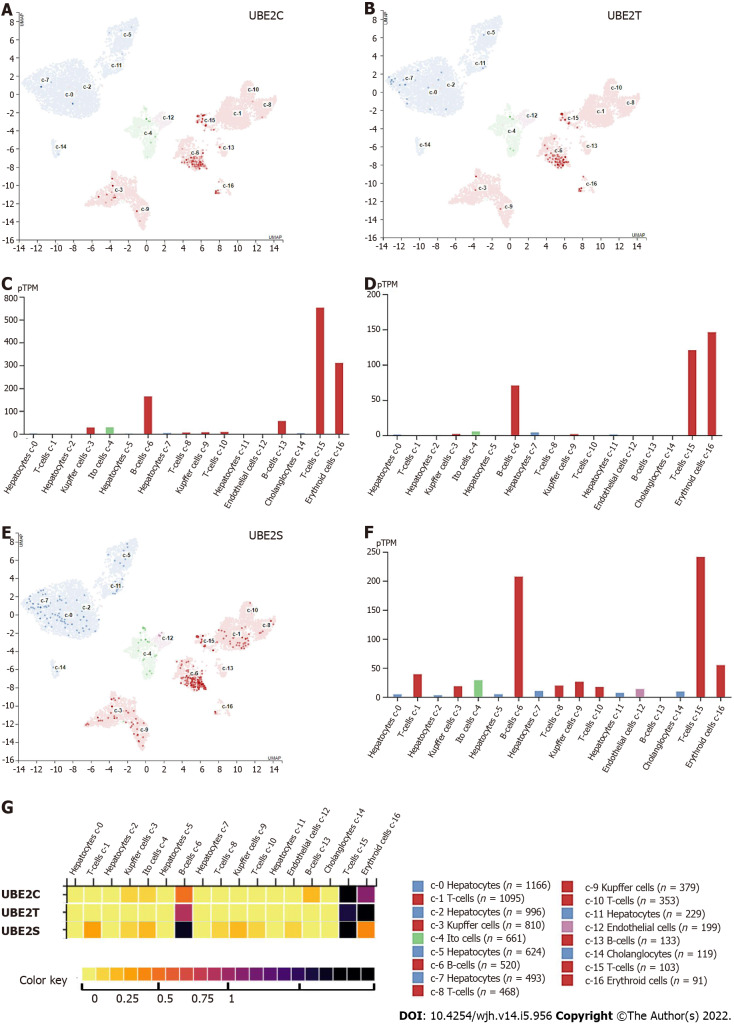
Figure 5.
UBE2C, UBE2T, and UBE2S mRNA expression in different cell types. A: UBE2C expressed genes in each cell cluster of scRNA-seq data; B: Bar plot of the transcript abundance of UBE2C in different cell types based on the scRNA-seq data. The level of UBE2C mRNA was represented by the mean pTPM (Protein-coding transcripts per million); C: UBE2T expressed genes in each cell cluster; D: Bar plot of the transcript abundance of UBE2T in different cell types based on the scRNA-seq data. The level of UBE2T mRNA was represented by the mean pTPM; E: UBE2S expressed genes in each cell cluster; F: Bar plot of the transcript abundance of UBE2S in different cell types based on the scRNA-seq data. The level of UBE2S mRNA was represented by the mean pTPM (Colored according to cell type group); G: Heat map of the expression level of UBE2C, UBE2T, and UBE2S. (Color key from 0-1 represent low–high expression).

