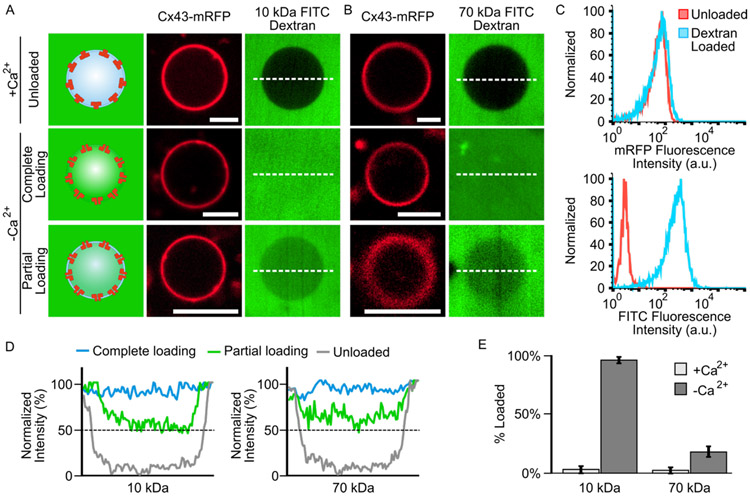
Figure 3.
Gap junction-mediated loading of 10 kDa and 70 kDa FITC dextran into connectosomes. (A) Confocal fluorescence images displaying 10 kDa FITC dextran being excluded from Cx43-delCT-mRFP connectosomes when 2 mM Ca2+ is present in solution and loaded into connectosomes when Ca2+ is removed from solution by the addition of 5 mM EGTA and EDTA chelators. (B) 70 kDa FITC dextran is also excluded from connectosomes when calcium is present and can be loaded into connectosomes when calcium is removed, again by the addition of chelators. Scale bars indicate 5 μm. (C) Flow cytometry histograms showing mRFP fluorescence of connectosomes and FITC fluorescence of 10 kDa dextran for unloaded and dextran loaded vesicles. Histograms quantify fluorescence from at least 10,000 events. (D) Line plots quantifying FITC fluorescence intensity across the dashed white lines in the confocal images, reveals the luminal FITC intensity within unloaded, completely loaded, and partially loaded connectosomes. The dashed black lines indicate 50% between unloaded and completely loaded luminal FITC intensity for both 10 kDa and 70 kDa dextran molecular weights. (E) A bar chart quantifies the percent loading of dextran into connectosomes when calcium is present or absent, and for both 10 kDa and 70 kDa dextran molecular weights. Error bars indicate standard deviation, n = 10 for all conditions.

