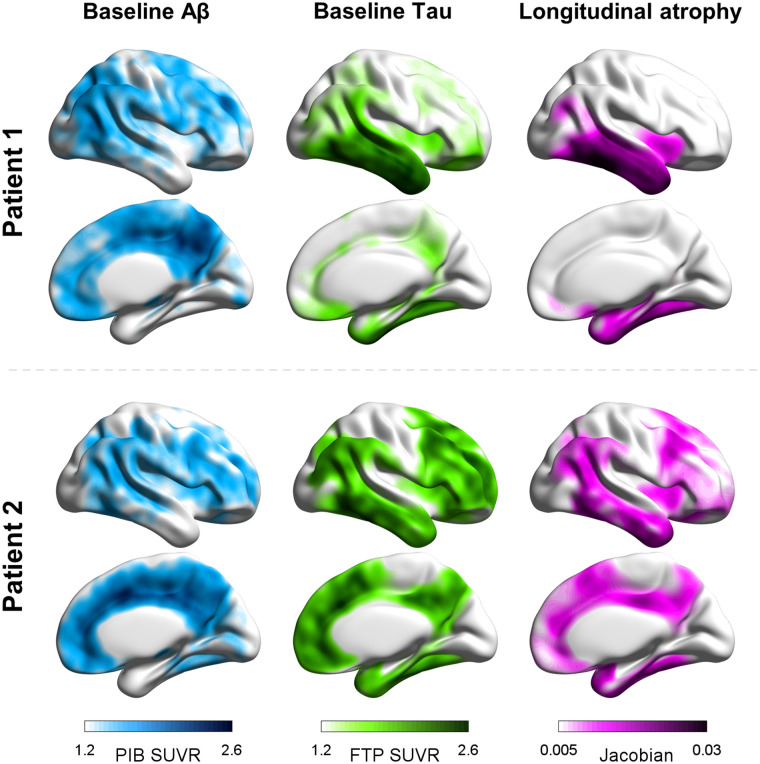
FIGURE 1.
Single-subject amyloid and tau PET patterns at baseline and cortical atrophy over time. (Left and middle) 11C-Pittsburgh compound B (PIB) and 18F-flortaucipir (FTP) PET SUV ratio maps, respectively, with higher values indicate more severe pathology. (Right) Patterns derived from prospective longitudinal structural MRI scans after PET, with positive Jacobians indicating shrinkage over time. Patient 1 is 71-y-old with mild AD dementia; patient 2 is 61-y-old with mild AD dementia.

