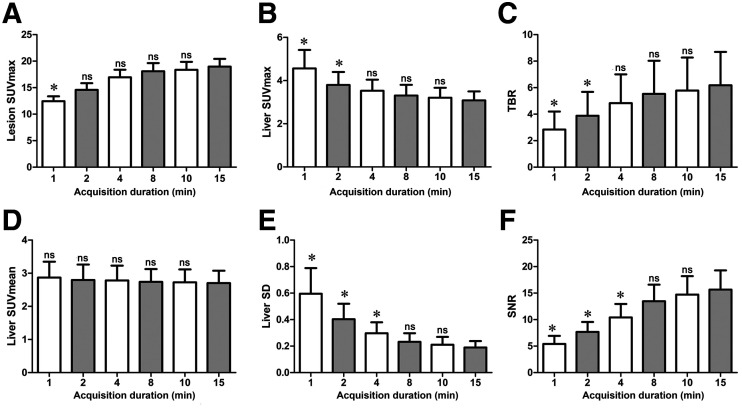
FIGURE 2.
Box plot of lesion SUVmax (A), liver SUVmax (B), TBR (C), liver SUVmean (D), liver SD (E), and SNR (F). Lesion SUVmax, TBR, and SNR increased with extension of acquisition time, whereas liver SUVmax, liver SUVmean, and SD decreased. Compared with G15, no significant differences for these parameters were found in G8 and G10. *P < 0.05. ns = not significant.

