
Figure 2.
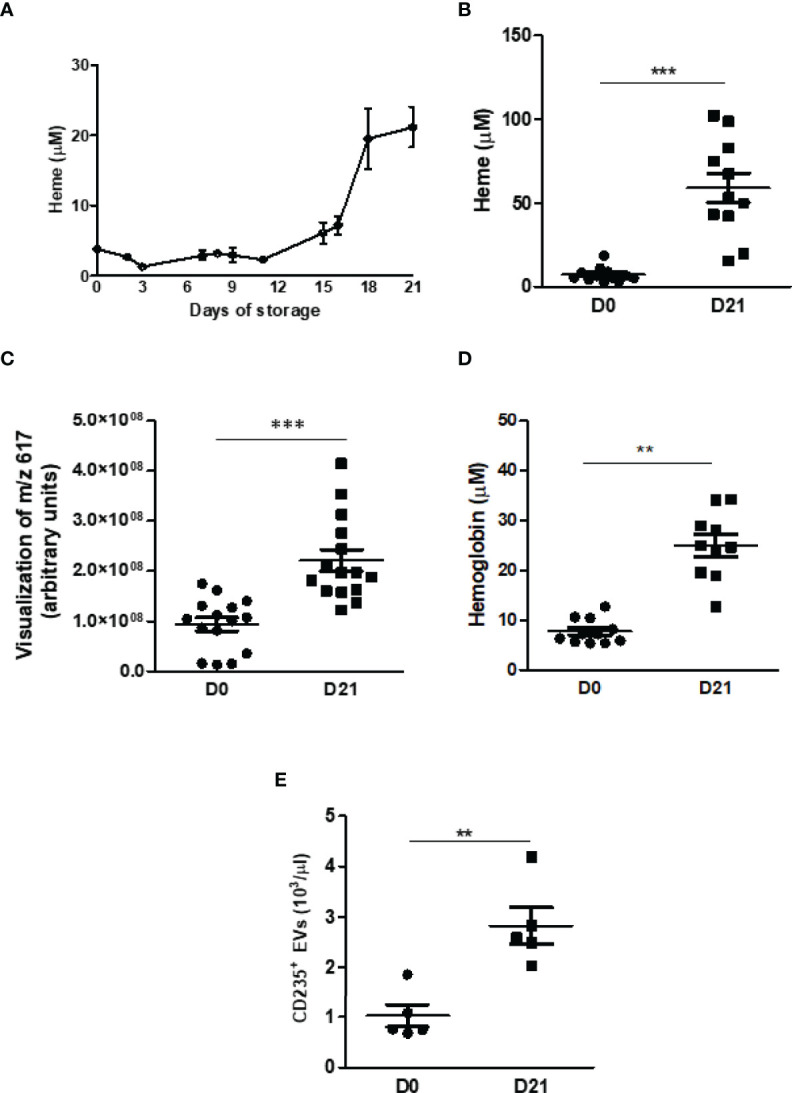
Quantification of heme, hemoglobin, and EVs in plasma. (A) Free heme concentrations were measured throughout 21 days. The analysis was performed via absorbance and read at 398 nm (n = 4). (B) Free heme concentrations were measured on day 21. The analysis was performed via absorbance and read at 398 nm (n = 11) and metabolomics and chemometric data evaluation via e the abundances of the ion m/z 617 (C). (D) Hemoglobin concentrations were measured on day 21. The analysis was performed via absorbance and read at 540 nm (n = 11). (E) The MPs were isolated from the plasma of fresh blood samples or previously stored at 4°C for 21 days. After centrifugation (70 min, 20000 x g, 4°C), they were resuspended in a buffer for specific binding. MP positive for the glycophorin protein (CD235) were quantified and are expressed as MP/μl plasma (n=6). Results are expressed as mean ± standard error (SEM). **Represents p < 0.01, ***represents p < 0.005.