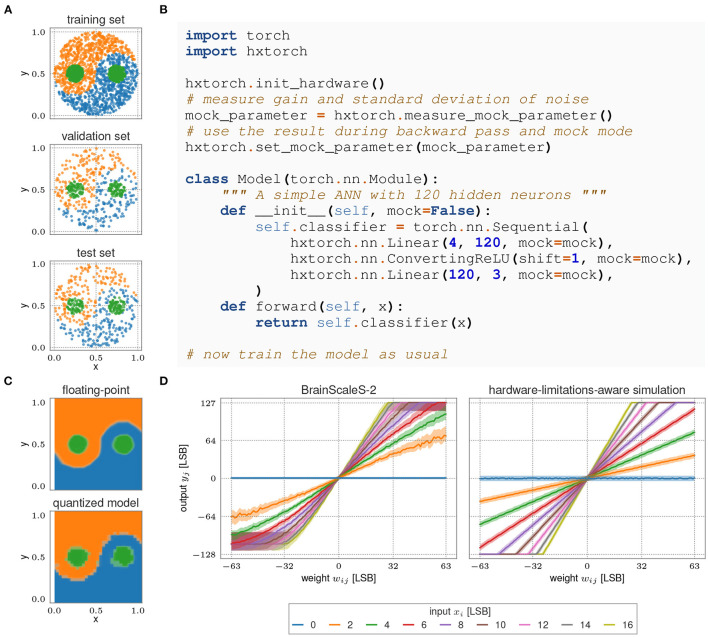
Figure 13.
(A) The Yin-Yang dataset (Kriener et al., 2021) used for the experiment. (B) Hardware initialization and model description with hxtorch. (C) Network response of the trained model depending on the input. (Top) 32 bit floating-point precision; (Bottom) Quantized model on BSS-2 (5 bit activations, 6 bit plus sign weights). (D) Output of the MAC operation on BSS-2 (left) compared to the linear approximation (right). The solid line indicates the median, the colored bands contain 95% of each neuron's outputs across 100 identical MAC executions.

