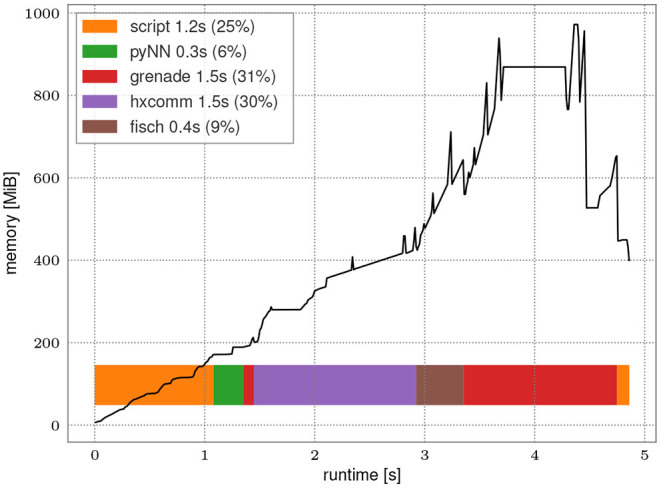
Figure 8.

Run time analysis of a PyNN-based experiment with large spike count. Population of 12 neurons is excited by a regular spike train with frequency of 1 MHz. The network is emulated for 1 s on hardware resulting in 1.2 × 10⁷ spike events. The black line represents memory consumption during execution. Horizontal bars represent time consumption in software layers. The annotations in the legend present the individual run time of steps and percentage of the overall run time.
