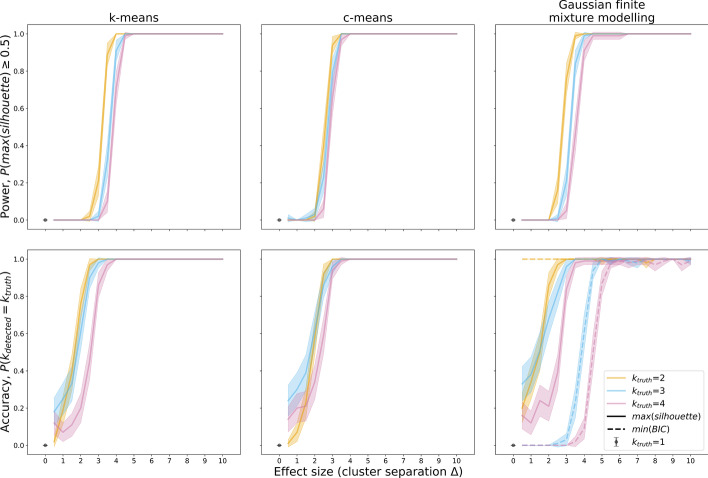
Fig. 13.
Power (top row) and cluster number accuracy (bottom row) for k-means (left column), c-means (middle column), and Gaussian mixture modelling (right column). Power was computed as the proportion of simulations in which the silhouette score was equal to or exceeded 0.5, the threshold for subgroups being present in the data. Cluster number accuracy was computed as the proportion of simulations in which the highest silhouette coefficient (solid lines) or the lowest Bayesian Information Criterion (dashed line, only applicable in Gaussian mixture modelling) was associated with the true simulated number of clusters. For each ground truth k = 1 to k = 4, 100 simulation iterations were run. In each iteration, all three methods were employed on the same data, and all methods were run for guesses k = 2 to k = 7

