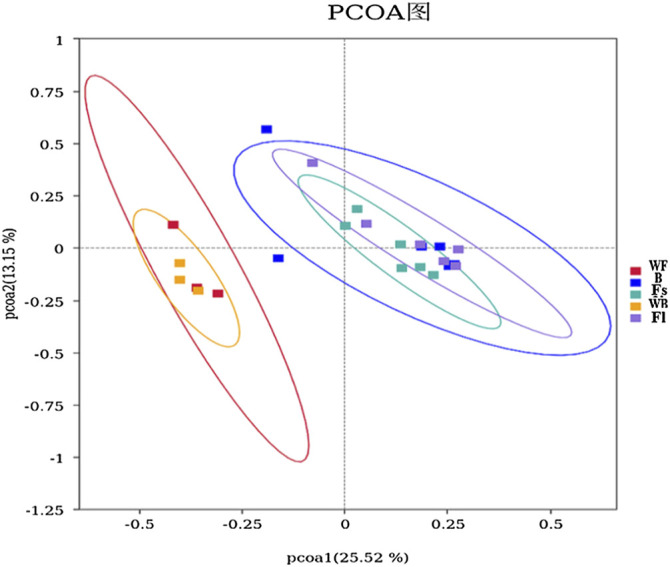
FIGURE 3.

PCoA analysis of microorganisms in the gut and water environment of each S. chuatsi group based on unweighted-UniFrac. Individual samples from different S. chuatsi groups and aquatic environments are shown as squares of different colors in the coordinate system, with similar samples showing a clustering trend.
