
FIGURE 1.
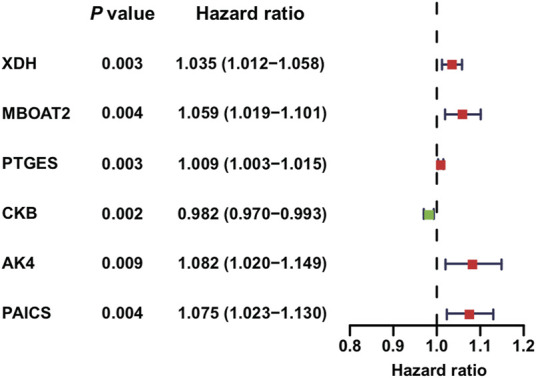
Identification of PDEMRGs in PAAD using TCGA database: forest plot of six PDEMRGs obtained from univariable Cox regression analysis (p ≤ 0.01): high-risk genes are represented in red (hazard ratios, HR > 1) and low-risk genes are represented in green (HR ≤ 1).