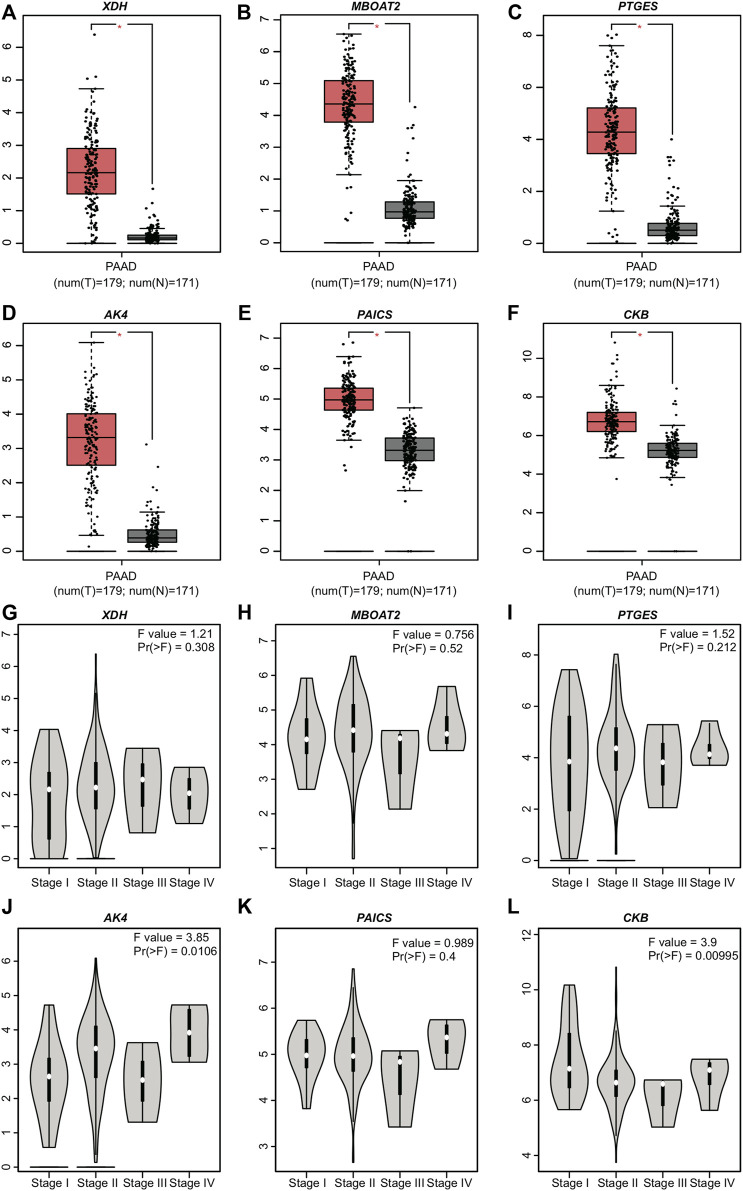
FIGURE 5.
Expression levels of the six PDEMRGs obtained from GEPIA database: (A–F) mRNA expression levels of the six PDEMRGs in PAAD and normal pancreatic tissues obtained from GEPIA database (*p ≤ 0.05)—red represents PAAD and gray represents normal pancreatic tissues, and (G–L) mRNA expression levels of the six PDEMRGs in PAAD with disease stage obtained from GEPIA database.

