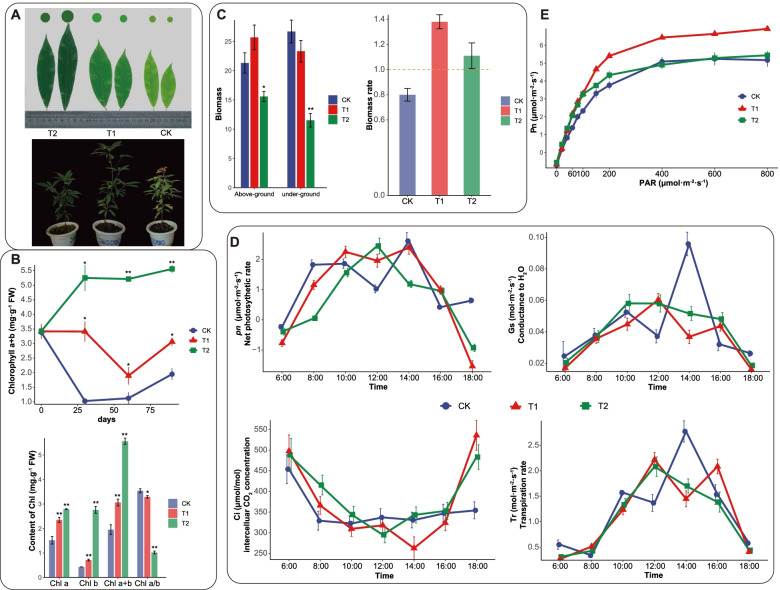
Fig. 1.
Phenotypic characterization and physiological changes of P. bournei under different shading treatments: CK represent the 100% light supply, T1 represents the 35% light, and T2 represents the 10% light. A Morphological comparisons under distinct treatments after 30 days. Under 10% illumination, the leaves of P. bournei had the deepest color and the largest shape. Under 100% illumination, the leaves were light green and the shapes were small. B The chl content comparisons among the different treatments after 30 days is shown. As the degree of shading increased, the content of chlorophyll, especially the content of chlorophyll b, significantly increased, while the ratio of chlorophyll a/b decreased. (T-test, * P < 0.05; ** P < 0.01). C Changes in the biomass of P. bournei aboveground and underground under different shading treatments. (T-test, * P < 0.05; ** P < 0.01) D Changes in the P. bournei net photosynthetic rate, stomatal conductance, intercellular CO2 concentration, and transpiration rate under different shading treatments. E The curve for the net photosynthetic rate with light intensity

