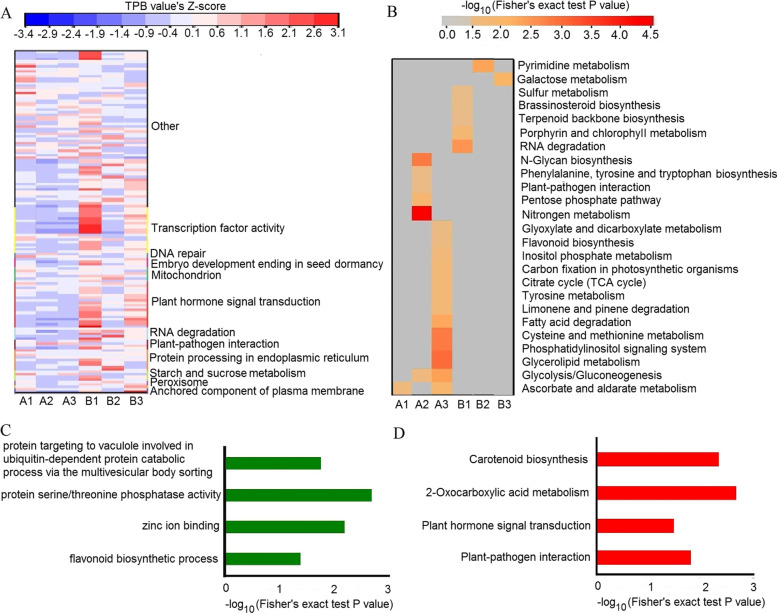
Fig. 3.
Functional cluster analysis and Gene Ontology (GO) and Kyoto Encyclopedia of Genes and Genomes (KEGG) enrichment analyses of target genes corresponding to the degradome transcripts. (A) Comparison of the abundance of degradome transcripts and TPB value based on the zero-mean normalization analysis of degradome transcripts in unaged and artificially aged WT, MIM164c and OE164c seeds. (B) KEGG enrichments of degradome transcripts unique to unaged and artificially aged WT, MIM164c, and OE164c seeds. (C) GO and (D) KEGG enrichments of target genes common to unaged and artificially aged WT and OE164c seeds but not to unaged and artificially aged MIM164c seeds. In (A) and (B), the greater the intensity of the red color, the higher the abundance of degradome transcripts; and the greater the intensity of the blue color, the lower the abundance of degradome transcripts. A1, A2, and A3 indicate unaged WT, MIM164c and OE164c seeds, respectively; B1, B2, and B3 represent artificially aged WT, MIM164c, and OE164c seeds, respectively

